|

Ethereum Classic Chart Analysis: ETC/USD looks north, inverse head-and-shoulders in play

  • ETC/USD consolidates Friday’s recovery below $6.70 on Saturday.
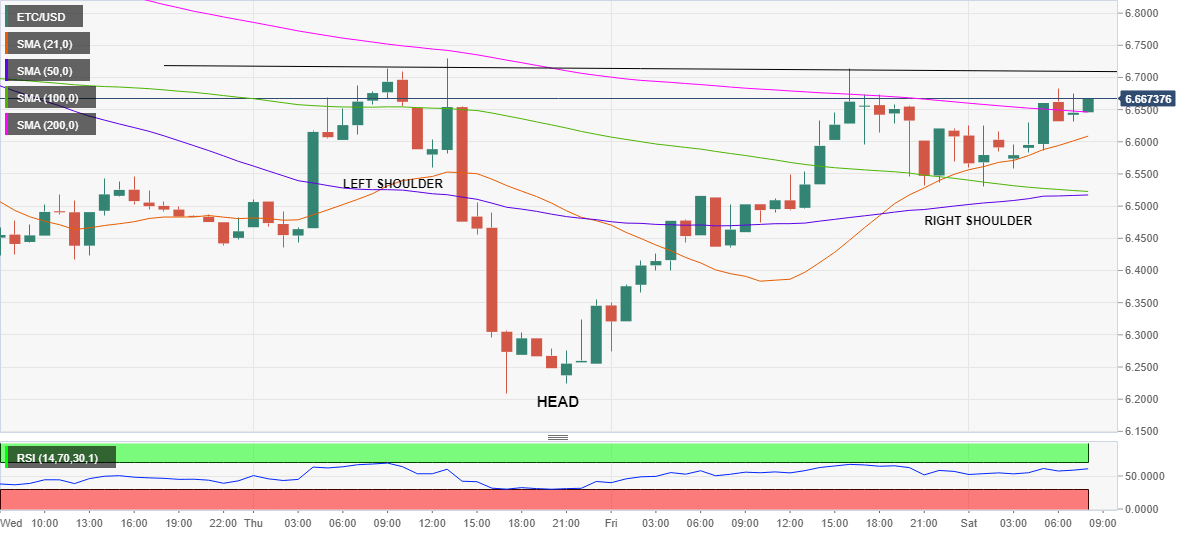
  • Bulls carve out inverse head-and-shoulders pattern on the hourly chart.
  • The coin eyes a sustained break above 200-HMA at $6.6478.

Ethereum Classic (ETC/USD) is in a consolidative mode so far this Saturday, having stalled a robust recovery just above the $6.6800 level.

Over the last hours, the spot is seen struggling to hold ground above the 200-hourly Simple Moving Averages (HMA), now placed at $6.6478.

The ETC bulls are awaiting a sustained break above the latter to challenge the horizontal trendline barrier at $6.7094, which is the neckline of the potential inverse head-and-shoulders formation carved over the past three trading sessions.

Should the pattern get confirmed, a test of the $7.00 mark looks inevitable in the coming days. The hourly Relative Strength Index (RSI) stays bullish at 61.98, backing the bullish case.

Alternatively, the upside bias would weakness if the price closes the day below the 21-HMA at $6.6079.

The bears will then target the $6.5200 support zone, where the intraday low, 50 and 100-HMAs coincide.

Friday’s low of $6.2745 could be the last resort for the ETC bulls.

ETC/USD: Hourly chart

fxsoriginal

ETC/USD: Additional levels to consider

ETC/USD

Overview
Today last price6.6451
Today Daily Change0.0368
Today Daily Change %0.56
Today daily open6.6084
 
Trends
Daily SMA206.8506
Daily SMA506.7612
Daily SMA1006.5903
Daily SMA2006.6502
 
Levels
Previous Daily High6.7133
Previous Daily Low6.2745
Previous Weekly High6.8886
Previous Weekly Low6.2096
Previous Monthly High7.5745
Previous Monthly Low5.5346
Daily Fibonacci 38.2%6.5457
Daily Fibonacci 61.8%6.4421
Daily Pivot Point S16.3508
Daily Pivot Point S26.0933
Daily Pivot Point S35.912
Daily Pivot Point R16.7896
Daily Pivot Point R26.9709
Daily Pivot Point R37.2285

Author

Dhwani Mehta

Dhwani Mehta

FXStreet

Residing in Mumbai (India), Dhwani is a Senior Analyst and Manager of the Asian session at FXStreet. She has over 10 years of experience in analyzing and covering the global financial markets, with specialization in Forex and commodities markets.

More from Dhwani Mehta
Share:

Editor's Picks

Uniswap extends rally amid Arc stablecoin liquidity partnership

Uniswap approaches $3.00 at the time of writing on Tuesday, extending its rebound for the sixth consecutive day. The rebound aligns with the broader risk-on mood in the crypto market, with Bitcoin trading above $67,000.

Crypto Today: Bitcoin extends recovery above $66K as Ethereum and XRP lose momentum

Bitcoin holds above $66,000, seemingly poised to extend its rebound, supported by growing retail demand. Ethereum struggles near the $1,800 short-term supply range despite a strengthening derivatives market.

Bitcoin rebound driven by fading selling pressure as demand remains subdued

Bitcoin extends its recovery, trading above $66,500 on Tuesday, marking four consecutive days of green candlesticks. Report highlights that BTC is staging a tentative relief bounce from deeply oversold conditions, suggesting stabilization rather than a trend reversal.

Zcash, Near Protocol, Hyperliquid regain bullish momentum after Arthur Hayes exit

Zcash, NEAR Protocol, and Hyperliquid edge higher on Tuesday, extending their recovery so far this week. Retail and institutional demand heats up for altcoins, fueling a rebound as prices fully absorb the impact of Arthur Hayes's exit.

Experts agree: Bitcoin nears bottom, but weak demand raises doubts
Bitcoin (BTC) is trading above $63,000 at the time of writing on Friday after rebounding from the key 200-week Simple Moving Average (SMA) near $62,000, a level widely viewed as key long-term support. The recovery may suggest that Bitcoin has found a floor after a sharp correction that spanned more than a month, but some warning signs persist.