|

Eos technical analysis: EOS/USD drops below $4 following two straight bearish days

  • EOS/USD is priced around $3.94 in the early hours of Friday.
  • Elliott Oscillator shows two straight bearish days.

EOS/USD daily chart

fxsoriginal

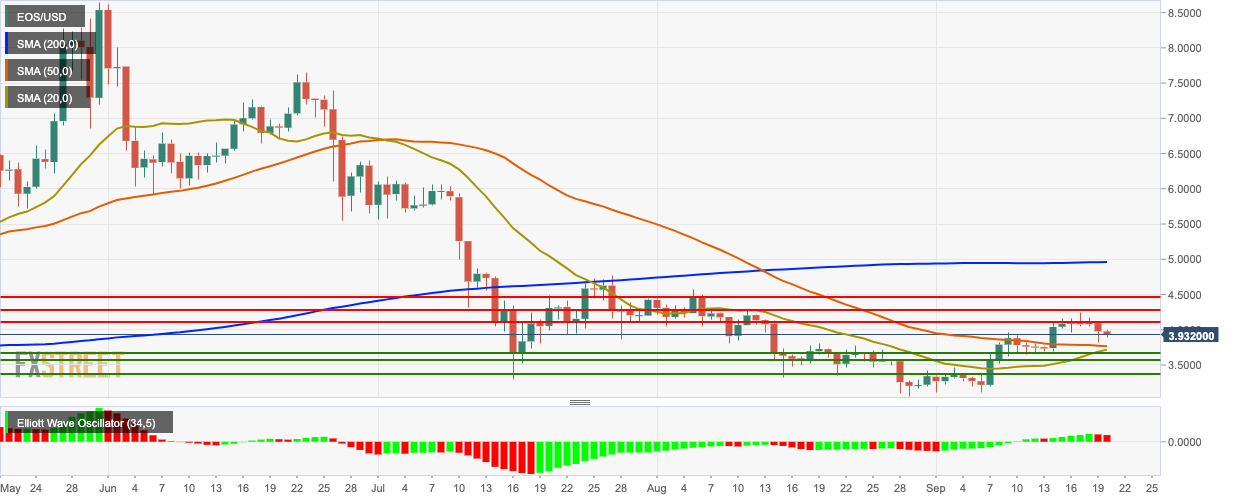
Over the last two days, EOS/USD has dropped from $4.09 to $3.94. The bulls have struggled to overcome resistance at $4.10 over the previous five days. The price is trending above the 50-day Simple Moving Average (SMA 50) and SMA 20 curves. The SMA 20 is also looking to cross over the SMA 50 curve, which is a bullish sign. The Elliott Oscillator has had two straight bearish sessions.

EOS/USD four-hour chart

fxsoriginal

The four-hour chart has found support at the upward trending line and the SMA 50 curve. On the upside, the resistance lies at the $3.97 line. The price is trending in the lower half of the 20-day Bollinger Band. The Moving Average Convergence/Divergence (MACD) indicator shows decreasing bearish intensity.

EOS/USD hourly chart

fxsoriginal

The hourly chart is trending below the green Ichimoku cloud. This Thursday, the price dropped till the $3.86 support level and then spiked up to $4. The bulls lost their momentum and then dropped down to $3.89, before finally settling around $3.94.

Key Levels

EOS/USD

Overview
Today last price3.9364
Today Daily Change-0.04220
Today Daily Change %-1.06
Today daily open3.9786
 
Trends
Daily SMA203.68845
Daily SMA503.77333
Daily SMA1004.65571
Daily SMA2004.9581
 
Levels
Previous Daily High4.0978
Previous Daily Low3.8202
Previous Weekly High3.9668
Previous Weekly Low3.5144
Previous Monthly High4.5778
Previous Monthly Low3.06
Daily Fibonacci 38.2%3.92624
Daily Fibonacci 61.8%3.99176
Daily Pivot Point S13.83327
Daily Pivot Point S23.68793
Daily Pivot Point S33.55567
Daily Pivot Point R14.11087
Daily Pivot Point R24.24313
Daily Pivot Point R34.38847


Author

Rajarshi Mitra

Rajarshi Mitra

Independent Analyst

Rajarshi entered the blockchain space in 2016. He is a blockchain researcher who has worked for Blockgeeks and has done research work for several ICOs. He gets regularly invited to give talks on the blockchain technology and cryptocurrencies.

More from Rajarshi Mitra
Share:

Editor's Picks

Ripple exposed to volatility amid low retail interest, modest fund inflows

Ripple (XRP) is extending its intraday decline to around $1.40 at the time of writing on Monday amid growing pressure from the retail market and risk-off sentiment that continues to keep investors on the sidelines.

Crypto Today: Bitcoin steadies around $70,000, Ethereum and XRP remain under pressure 

Bitcoin hovers around $70,000, up near 15% from last week's low of $60,000 despite low retail demand. Ethereum delicately holds $2,000 support as weak technicals weigh amid declining futures Open Interest.

Pi Network extends decline as steady mainnet migration adds pressure

PI edges lower by over 3% at press time on Monday, marking a third consecutive day of losses. The declining trend in PI aligns with the steady mainnet migration of PI tokens, which may fuel selling pressure. The technical outlook for PI remains bearish, with bearish momentum persisting. 

Bitcoin slips below $70,000 as ETF outflows, realized losses fuel bearish outlook

Bitcoin price trades in red below $70,000 on Monday after correcting nearly 9% in the previous week. US-listed spot ETFs recorded a $318 million weekly outflow, marking the third consecutive week of withdrawals.

Bitcoin Price Annual Forecast: BTC holds long-term bullish structure heading into 2026

Bitcoin (BTC) is wrapping up 2025 as one of its most eventful years, defined by unprecedented institutional participation, major regulatory developments, and extreme price volatility.

Bitcoin: The worst may be behind us

Bitcoin (BTC) price recovers slightly, trading at $65,000 at the time of writing on Friday, after reaching a low of $60,000 during the early Asian trading session. The Crypto King remained under pressure so far this week, posting three consecutive weeks of losses exceeding 30%.