Enjin Coin price leads the cryptocurrency complex higher, but ENJ still range-bound
- Enjin Coin price remains locked in a broadening descending wedge pattern.
- March 22 low proves to be the line in the sand for the current decline.
- Average profit/loss of all coins hits the lowest level since March 2020.

Enjin Coin price has commanded attention over the last 12+ hours with a gain of over 22% at the time of writing. However, it is essential to point out that ENJ is locked in a downtrend and is staring at formidable resistance at current levels.
Enjin Coin price climbs as catastrophic voices are silenced
The MVRV metric shows the average profit/loss of all coins currently according to the current price. More specifically, ‘MV’ stands for market value and simply describes the market capitalization. The second component is ‘RV,’ which stands for realized value.
Higher MVRV (30d) values indicate that more people are willing to sell and take profits and lower values mean that most people will be realizing losses if they sell all their holdings.
This metric tends to rise during strong and long bull runs and decreases during bear markets. The rationale is that during solid bull runs, the long-term holders determine when the bull run will end by selling their positions. During bear markets, the long-term holders are at a loss on average, and the short-term holders manage to realize profits.
The current reading is -14.14%, up from the April 23 low of -28.5%. The metric low undercut the September 2020 low and reached the lowest level since March 2020, before the massive advance. As a result, the ENJ MVRV (30d) has reached a noteworthy undervalued reading, pointing to at least a dead-cat bounce, but it does not guarantee a new, sustainable rally.
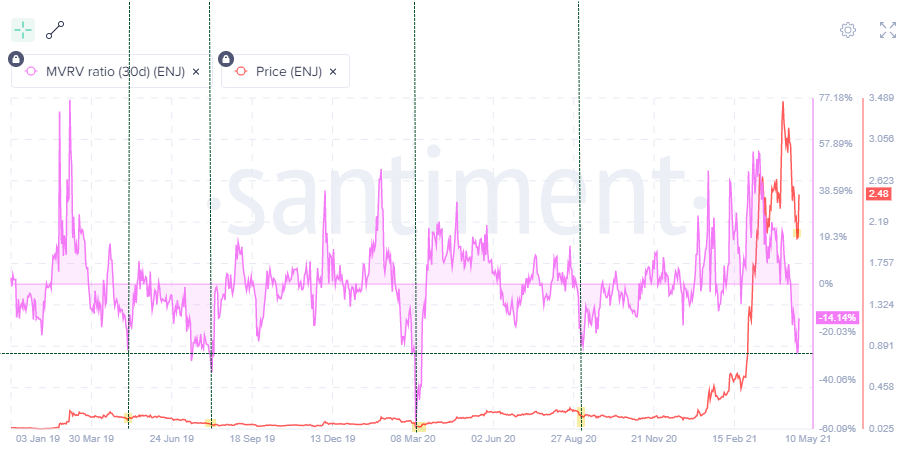
ENJ MVRV ratio (30d)
The developing ENJ rebound is substantive, putting it near the top of the best-performing cryptocurrencies today. Still, it has not facilitated a push above the broadening declining wedge pattern’s upper trend line at $2.51 on a closing basis. The trend line also intersects with the 100 twelve-hour simple moving average (SMA) at $2.47
With the momentum now to the upside, it is appropriate to consider some upside targets/resistance levels. The $2.47-$2.51 level is omnipresent at the moment, but the 50 twelve-hour SMA is not far above at $2.68. A burst above the moving average should put ENJ on a collision course with the March high at $3.12 and the 61.8% Fibonacci retracement of the April correction at $3.13.
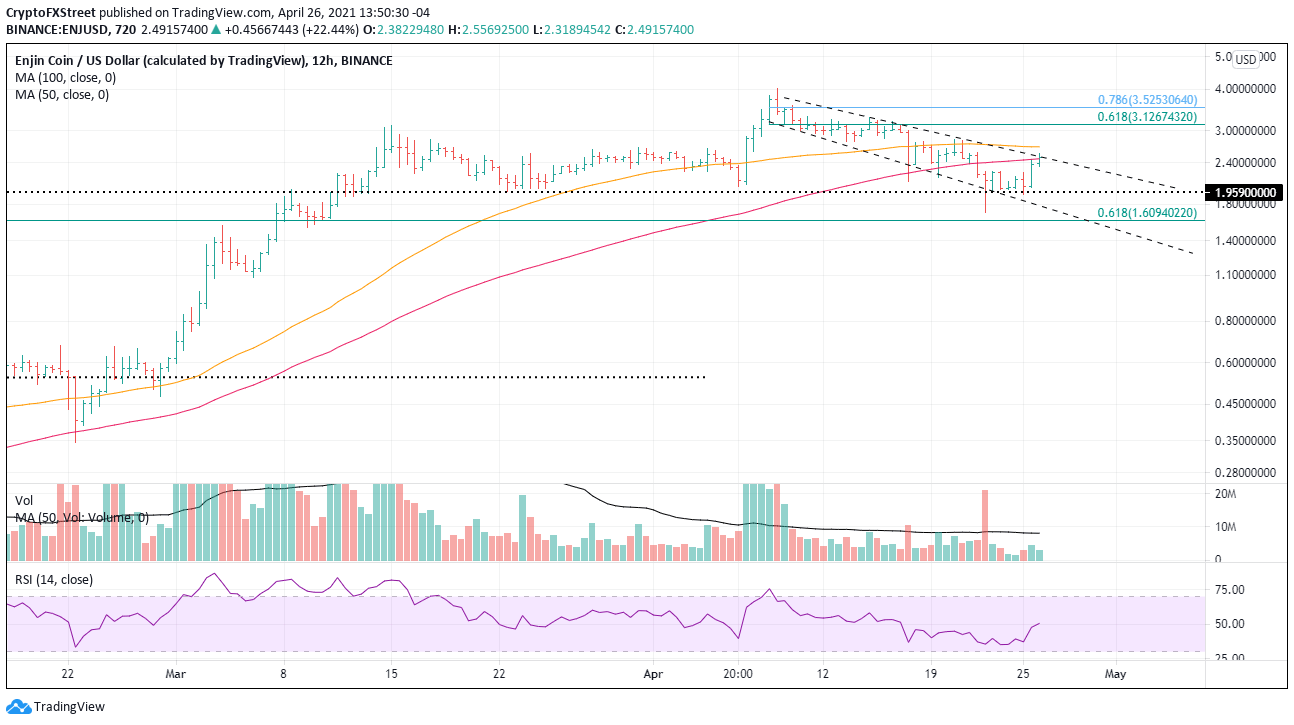
ENJ/USD 12-hour chart
A reversion to the downside will not discover support until the March 22 low at $1.96 and the wedge’s lower trend line at $1.77. Any washout below the trendline will find support at the 61.8% retracement of the 2021 advance at $1.61.
Author

Sheldon McIntyre, CMT
Independent Analyst
Sheldon has 24 years of investment experience holding various positions in companies based in the United States and Chile. His core competencies include BRIC and G-10 equity markets, swing and position trading and technical analysis.


