Elrond Price Prediction: EGLD primed for a 60% gain in the coming weeks
- Elrond price holding $130.00 on a weekly closing basis.
- Relative Strength Index (RSI) still showing EGLD is overbought.
- Key moving average has caught up with price.

Elrond (EGLD) price, taken from an intra-week analysis, crashed almost 60% in February. However, if the weekly closes are used, EGLD corrected only 15% during the month. In February, the two down weeks registered losses of just 9% and 6.9% on a closing basis. A complete contrast to the intra-week numbers and it alerts traders that potential selling pressure was exhausted in the big shakeouts during those two weeks.
Elrond price contained in a well-defined price range
When price advances almost 900% over nine weeks, there will be a significant deviation from the mean, in this case, the 10-week simple moving average (SMA). At the February high at $217.03, Elrond price was almost 300% above the 10-week SMA. By far the largest deviation from the moving average since EGLD started trading. The major decline was a reaction to the extreme condition.
Today, the 10-week SMA is only 8% below the price and now becomes a major support level for any Elrond price weakness moving forward while giving traders a good risk level for trading.
The volume trend is also complementary to the bullish narrative, as it has steadily declined over the last four weeks, affirming the interpretation that selling pressure is exhausted.
The only obstacle in front of a renewed advance is the lingering overbought condition. An ideal scenario would be for Elrond price to continue to trade sideways for a couple more weeks to release the overbought condition and then launch the breakout above $168.76.
After a daily close above $168.76, Elrond price should swiftly advance to the all-time high at $217.03, locking in a 64% gain from current trading levels. More ambitious profit targets are the 1.382 extension at $265.25 and the 1.618 extension level at $295.04.
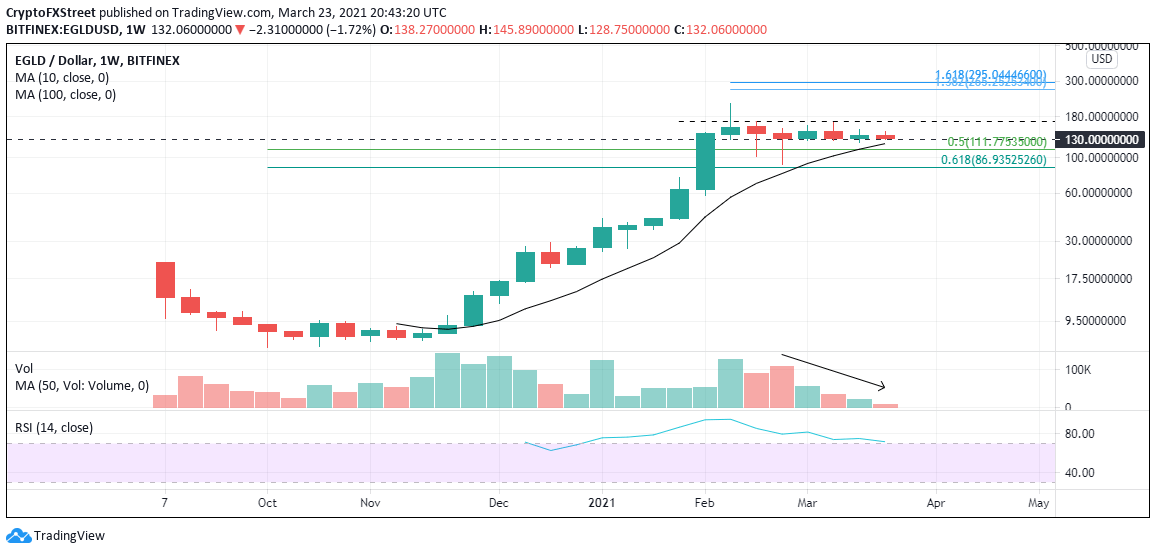
EGLD/USD weekly chart
Bears will take command on a daily close below the 0.50 retracement level of the entire gain from October 2020 at $111.77. The February low coincides with the 0.618 Fibonacci retracement level at $90.79, and it will give respite to the selling pressure.
Author

Sheldon McIntyre, CMT
Independent Analyst
Sheldon has 24 years of investment experience holding various positions in companies based in the United States and Chile. His core competencies include BRIC and G-10 equity markets, swing and position trading and technical analysis.


