Dogecoin Price Prediction: Will the Bitcoin of meme coins make it to $0.2 amid halving and DOGE Day euphoria?
- Dogecoin price holds above an ascending trendline despite growing overhead pressure.
- Bitcoin halving and DOGE Day could set the tone for altcoins to rally.
- A rising wedge pattern has it out for Dogecoin price, but bullish narratives could see fortunes change for DOGE holders.
Dogecoin (DOGE) price is trading with a bullish bias, all things considered, consolidating along an ascending trendline despite the toned-down upside momentum seen across the market. Meanwhile, Bitcoiners and cryptocurrency enthusiasts in general continue to celebrate the fourth Bitcoin halving, and this could bode well for Dogecoin as DOGE Day sets in.
Also Read: Dogecoin price could make a 15% recovery as DOGE market attempts to determine a bottom
DOGE price could show strength amid Dogecoin Day hype
On the same day as the Bitcoin halving, April 20, the DOGE community is celebrating the Dogecoin Day, a social media campaign and movement intended to raise awareness and increase the value of Dogecoin.
Happy doge day to all #dogecoin #hodlers Let's all buy some doge to celebrate this day! We won't see this price for long! #dogecointothemoon pic.twitter.com/cVfwWSIEOp
— Matthew Bonnici XĐ (@matbon1982) April 20, 2024
Dogecoin was created in 2013 based on the popular "Doge" meme featuring a Shiba Inu dog and has since gained a strong community following.
On the 12-hour timeframe, Dogecoin price holds well above the ascending trendline, which provides downward support and is reinforced by the 200-day Simple Moving Average (SMA). The Relative Strength Index (RSI) has crossed above the yellow band of the signal line which is a bullish crossover interpreted as a buy signal. The same crossover can be seen on the Moving Average Convergence Divergence (MACD), crossing above the orange band of the signal line.
Should the DOGE bulls heed the buy signal, Dogecoin price could push north to confront resistance due to the 100-day Simple Moving Average (SMA) at $0.1718. If this moving average fails to hold as resistance, the Bitcoin of meme coins could shatter past it to confront the 50-day SMA at $0.1830. In a highly bullish case, the gains could see the Dogecoin price tag the $0.2000 psychological level, nearly 33% above current levels.
A break and close above the $0.2000 psychological level on the 12-hour timeframe would negate the ascending wedge that governs Dogecoin price action.
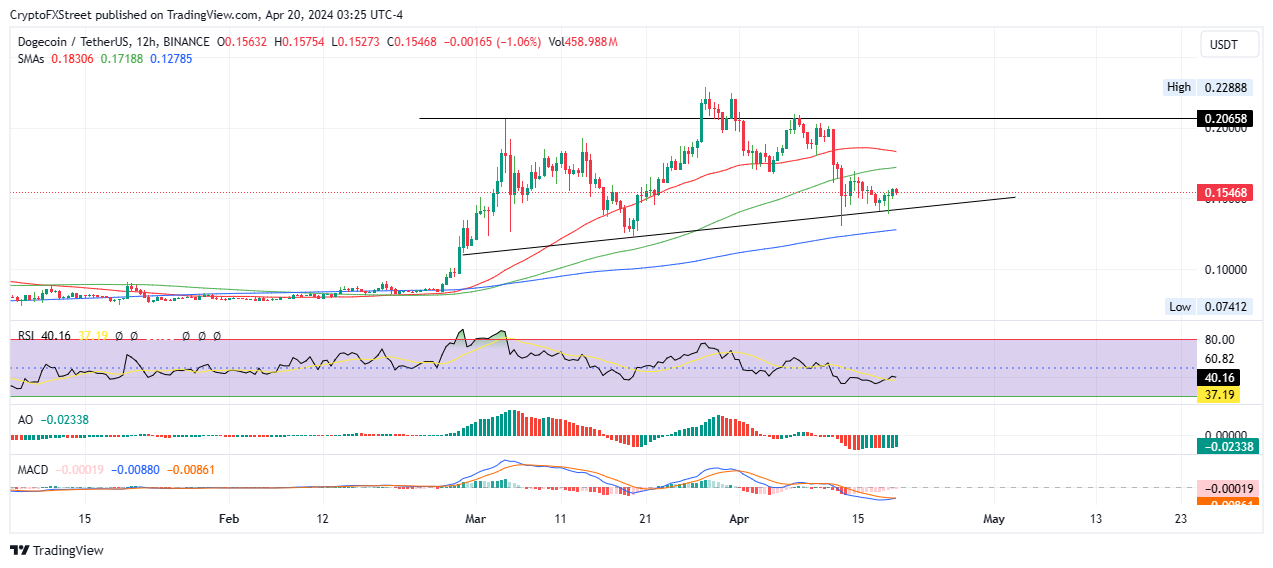
DOGE/USDT 1-day chart
If the $0.2000 blockade fails to break, however, Dogecoin price could face a rejection that could go as low as below the support offered by the ascending trendline. In a dire case, the DOGE price could slip below the 200-day SMA at $0.1278 to test the bottom of the market range at $0.1000 psychological level.
Author

Lockridge Okoth
FXStreet
Lockridge is a believer in the transformative power of crypto and the blockchain industry.


