Dogecoin price poised for 13% rally after finding support on a key level
- Dogecoin price finds support around $0.118, the 200-week EMA.
- On-chain data shows DOGE’s development activity is increasing, signaling positive sentiment among investors.
- A weekly candlestick close below $0.118 would invalidate the bullish thesis.
Dogecoin (DOGE) price has stabilized around $0.118, aligning with the 200-week Exponential Moving Average (EMA), while on-chain data reveals a rising trend in DOGE's development activity, reflecting optimistic sentiment among investors. With these indicators in place, DOGE appears poised for a bullish upswing in the coming days.
Dogecoin shows potential for a move-up
Dogecoin price found support at the 200-week EMA around the $0.118 level and, at the time of writing, trades at $0.125 on Friday.
The 200-week EMA roughly coincides with the weekly support level of $0.118, considered a key support level.
If this support level holds, DOGE could rally 13% to retest its resistance level at $0.142, the 50% price retracement level between $0.055 to $0.228 from August 14 2023, to March 25 2024, respectively.
The Relative Strength Index (RSI) on the weekly chart has briefly slipped below the 50 neutral level, while the Awesome Oscillator (AO) is on its way to doing the same. If bulls are indeed making a comeback, then both momentum indicators must maintain their positions above their respective neutrality levels. Such a development would add a tailwind to the recovery rally.
If DOGE closes above $0.142, it could extend an additional 20% rally to retest its next weekly resistance level at $0.171.
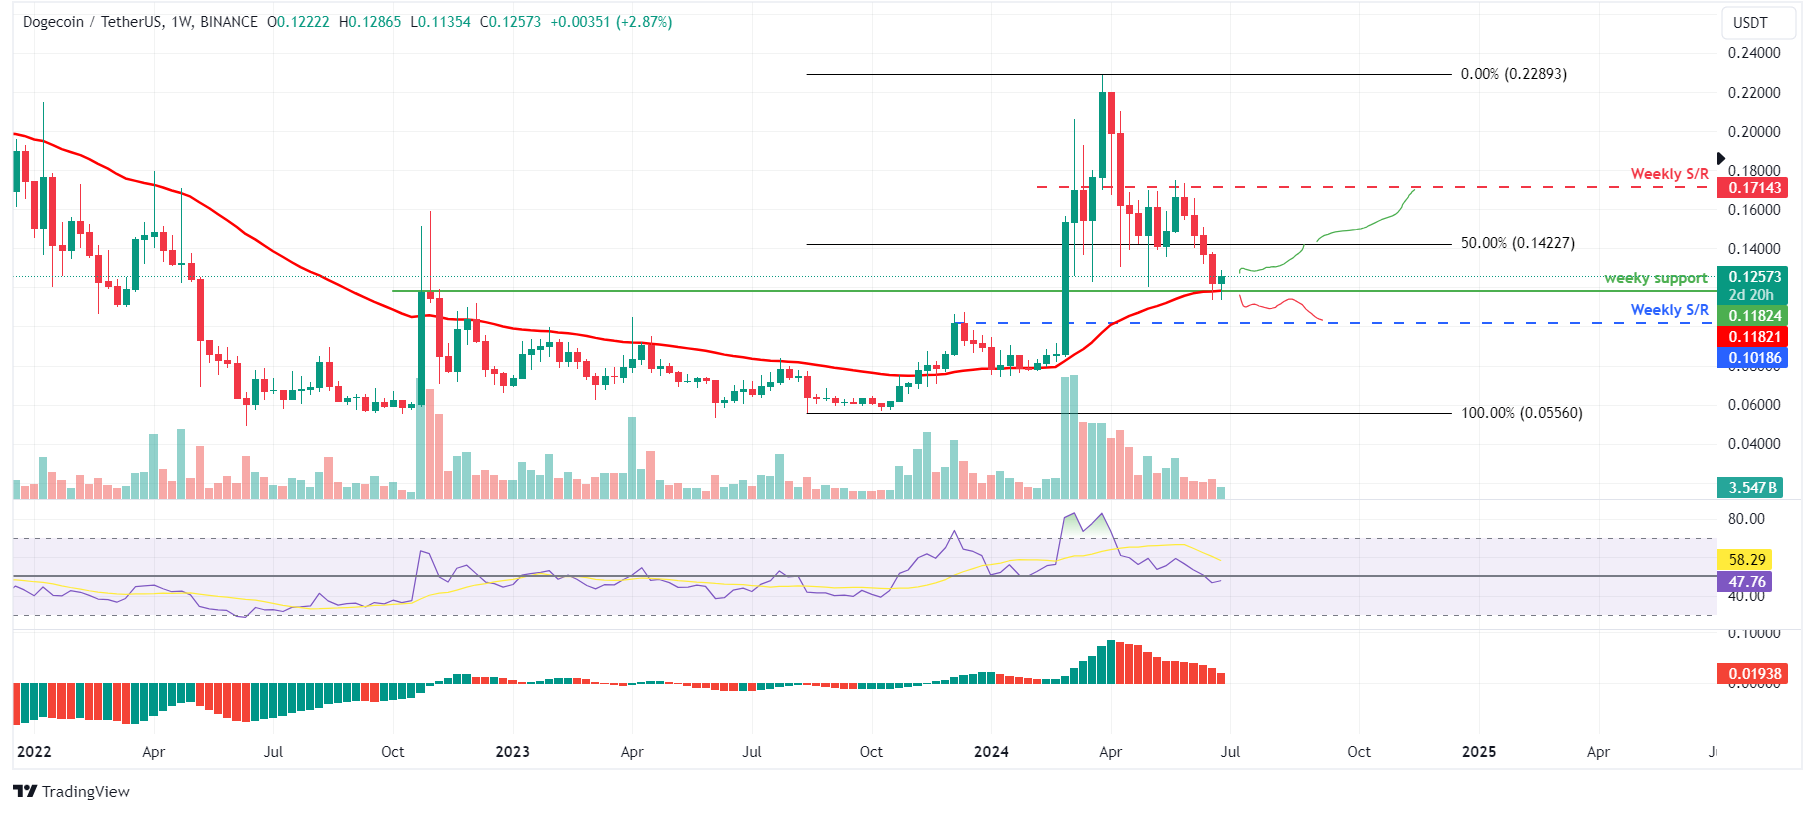
DOGE/USDT weekly chart
Based on IntoTheBlock's Global In/Out of the Money (GIOM), nearly 194,960 addresses accumulated 42.19 billion DOGE tokens at an average price of $0.107. These addresses bought the dog-based meme token between $0.098 and $0.121, which makes it a key support zone. These investors will likely add more to their holdings if the price retraces.
Interestingly, the $0.098 to $0.121 zone mentioned from a technical analysis perspective coincides with the GIOM findings, making this zone a key reversal area to watch.
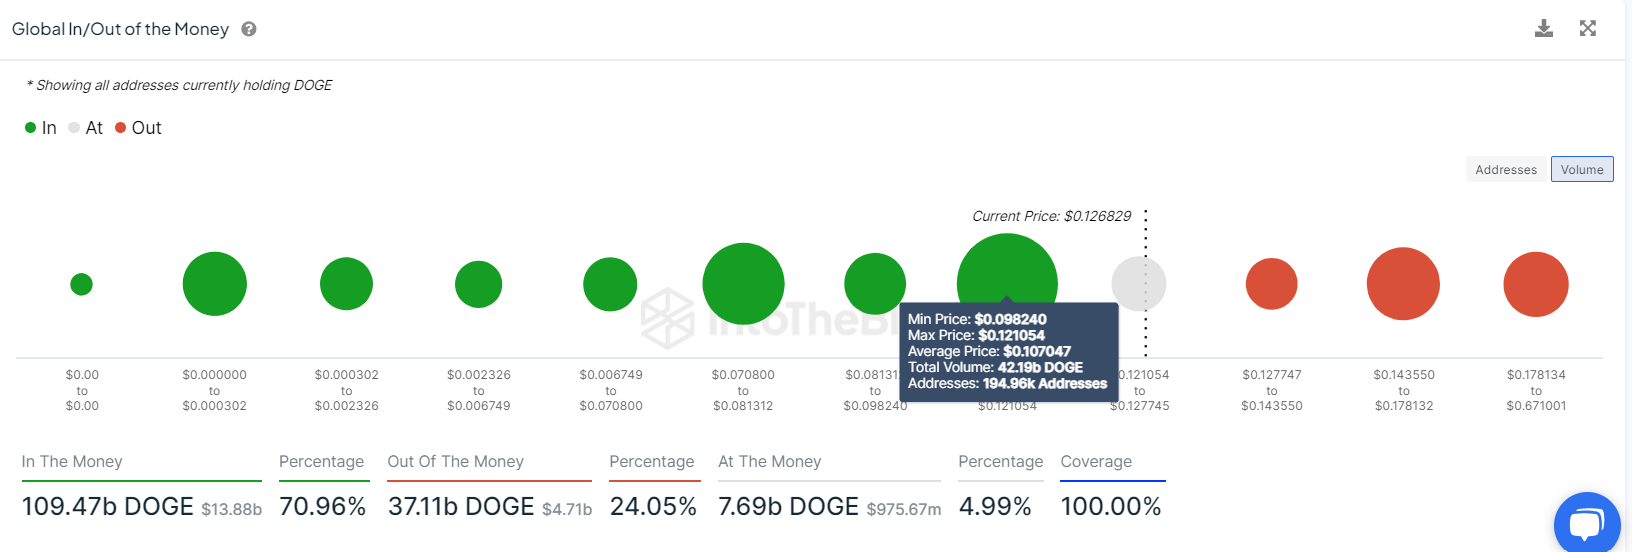
DOGE GIOM chart
Also, Santiment’s Development Activity metric monitors the frequency of development events documented in the public GitHub repository over a period of time. An increase in this metric typically indicates ongoing efforts to maintain, innovate, and enhance the protocol, which is generally viewed positively by investors and stakeholders. Conversely, a decrease in this metric could lead to concerns regarding the project's sustainability, ability to innovate, and interaction with the community in the coming times.
As in DOGE’s case, the index rose 17% on Thursday and has constantly increased since the start of June. The rise in DOGE’s developing activity adds further credence to the bullish outlook.
%20[09.03.30,%2028%20Jun,%202024]-638551488439018064.png)
DOGE Development Activity
Even though the on-chain metric and technical analysis point to a bullish outlook, if DOGE’s weekly candlestick closes below $0.118, the weekly support level, this move would invalidate the bullish thesis by producing a lower low on a weekly timeframe. This development could see Dogecoin’s price fall 14% to the next weekly support level of $0.101.
Author

Manish Chhetri
FXStreet
Manish Chhetri is a crypto specialist with over four years of experience in the cryptocurrency industry.


