Dogecoin Price Forecast: DOGE is back on track to hit all-time highs
- Dogecoin price is bounded inside an ascending triangle pattern on the 12-hour chart.
- Several indicators show that the digital asset will not have a lot of trouble breaking out.
- Nonetheless, Dogecoin remains extremely volatile in the short-term.

Dogecoin price has been trading sideways for a bit, but it’s ready for another leg up as it faces weak resistance ahead. The digital asset is aiming for a breakout of a key pattern formed on the 12-hour chart.
Dogecoin price on the verge of a new breakout
Dogecoin has established an ascending triangle pattern on the 12-hour chart with a resistance trendline formed at $0.062 and basically no resistance ahead. Since DOGE has defended the lower boundary of the pattern, it will most likely rise towards the top at $0.062.
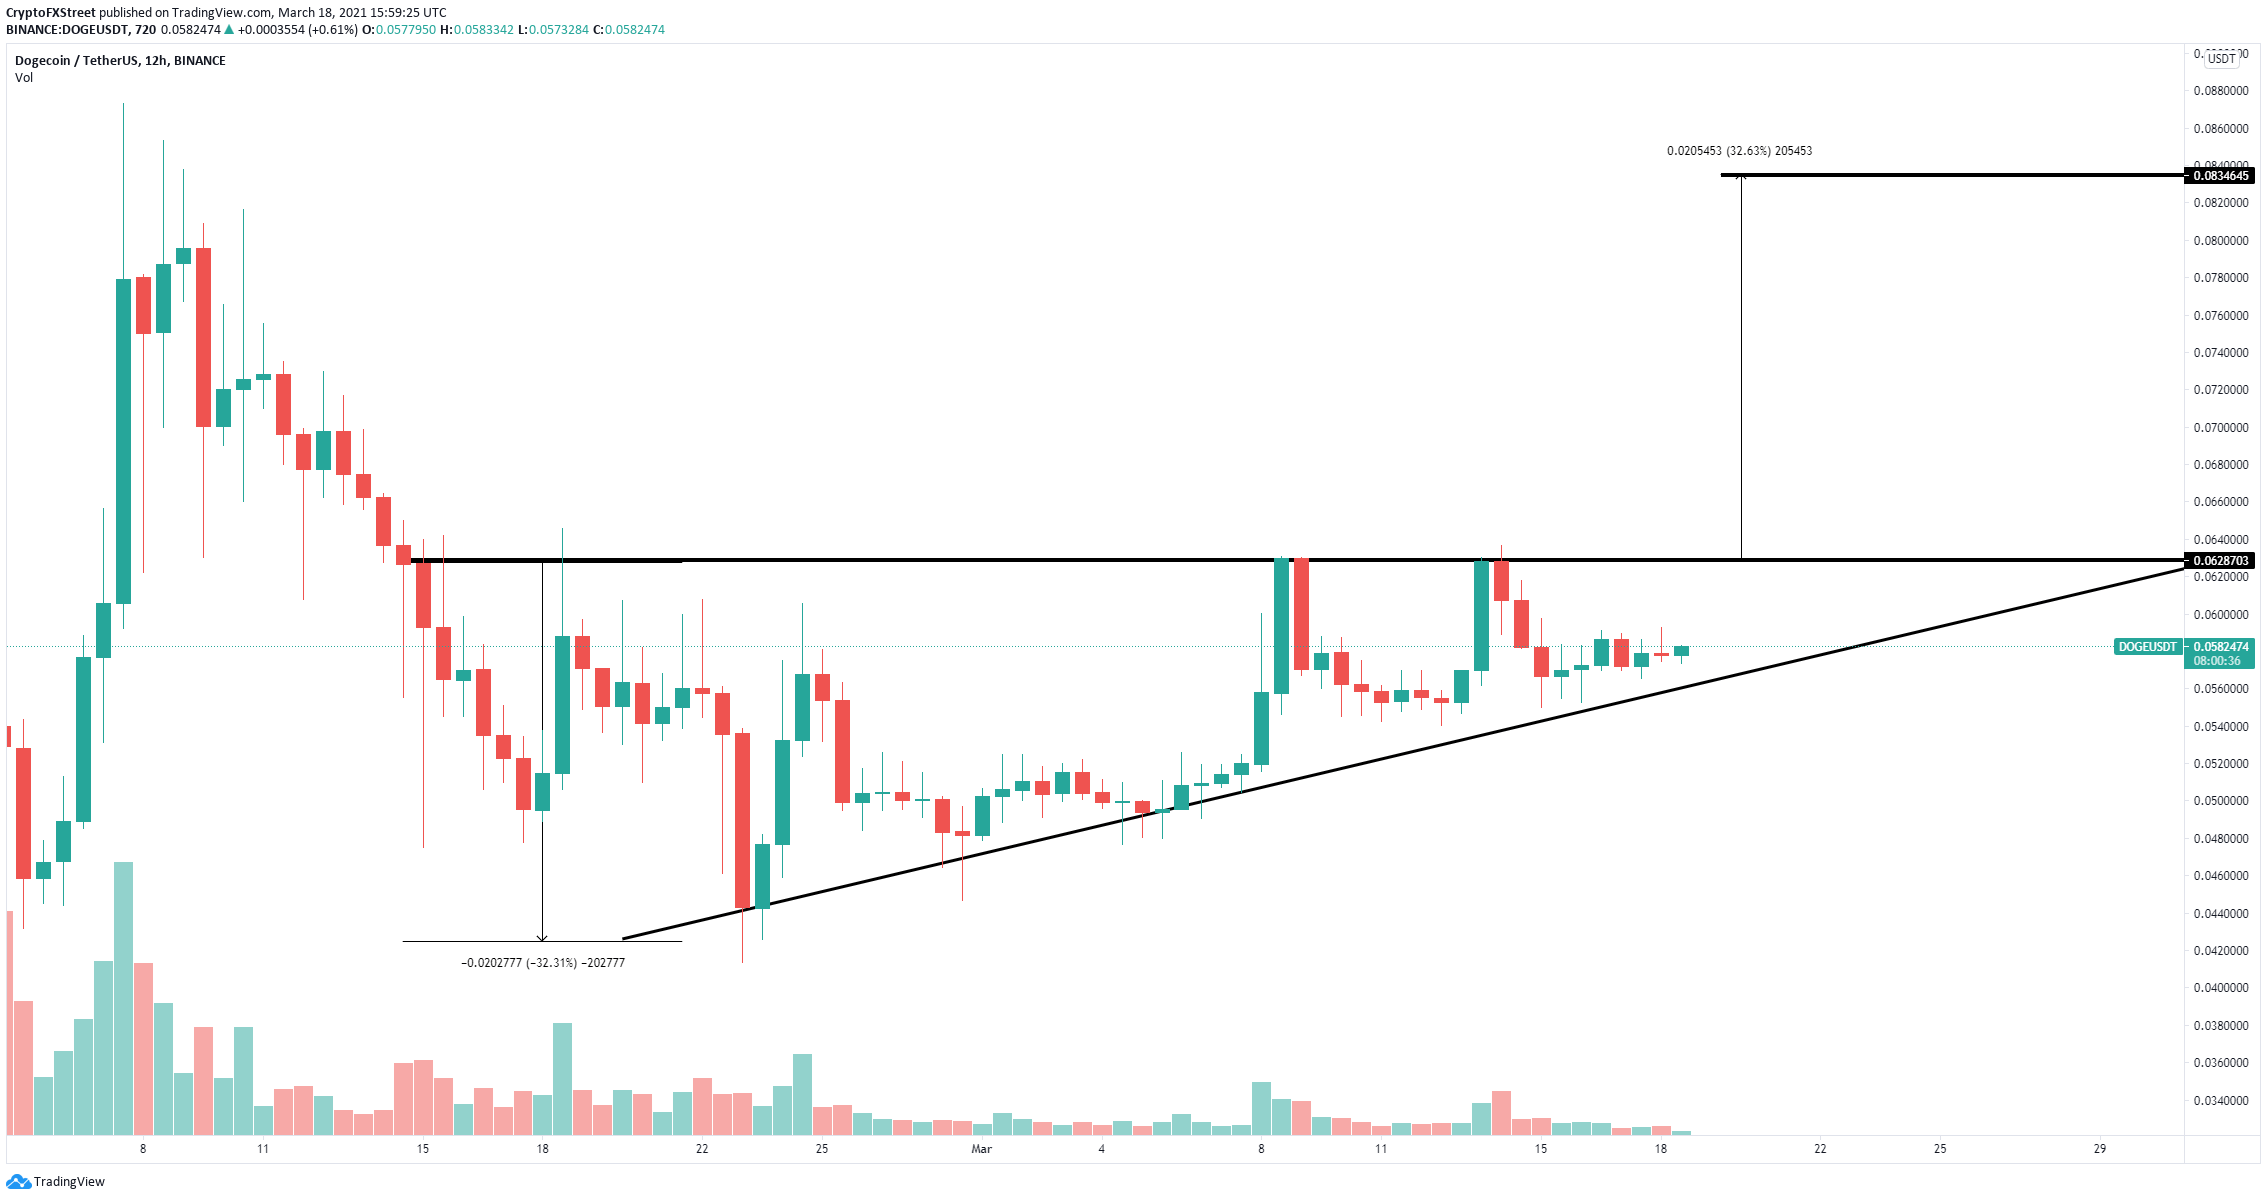
DOGE/USD 12-hour chart
A breakout above the upper trendline of the pattern at $0.0628 should quickly drive Dogecoin price towards $0.083 with no difficulties. The In/Out of the Money Around Price (IOMAP) chart adds credence to this outlook as it shows practically no barriers ahead.
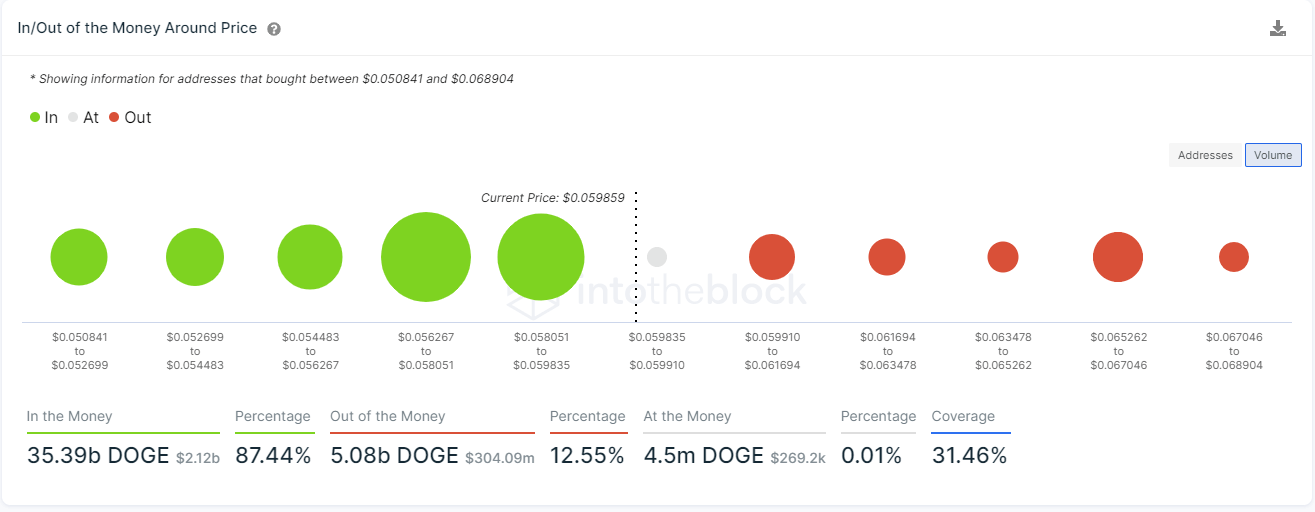
DOGE IOMAP chart
The strongest resistance area is located between $0.065 and $0.067, which means Dogecoin could briefly pause there before $0.083. On the other hand, the bears will need to crack several massive support levels to invalidate the bullish outlook.
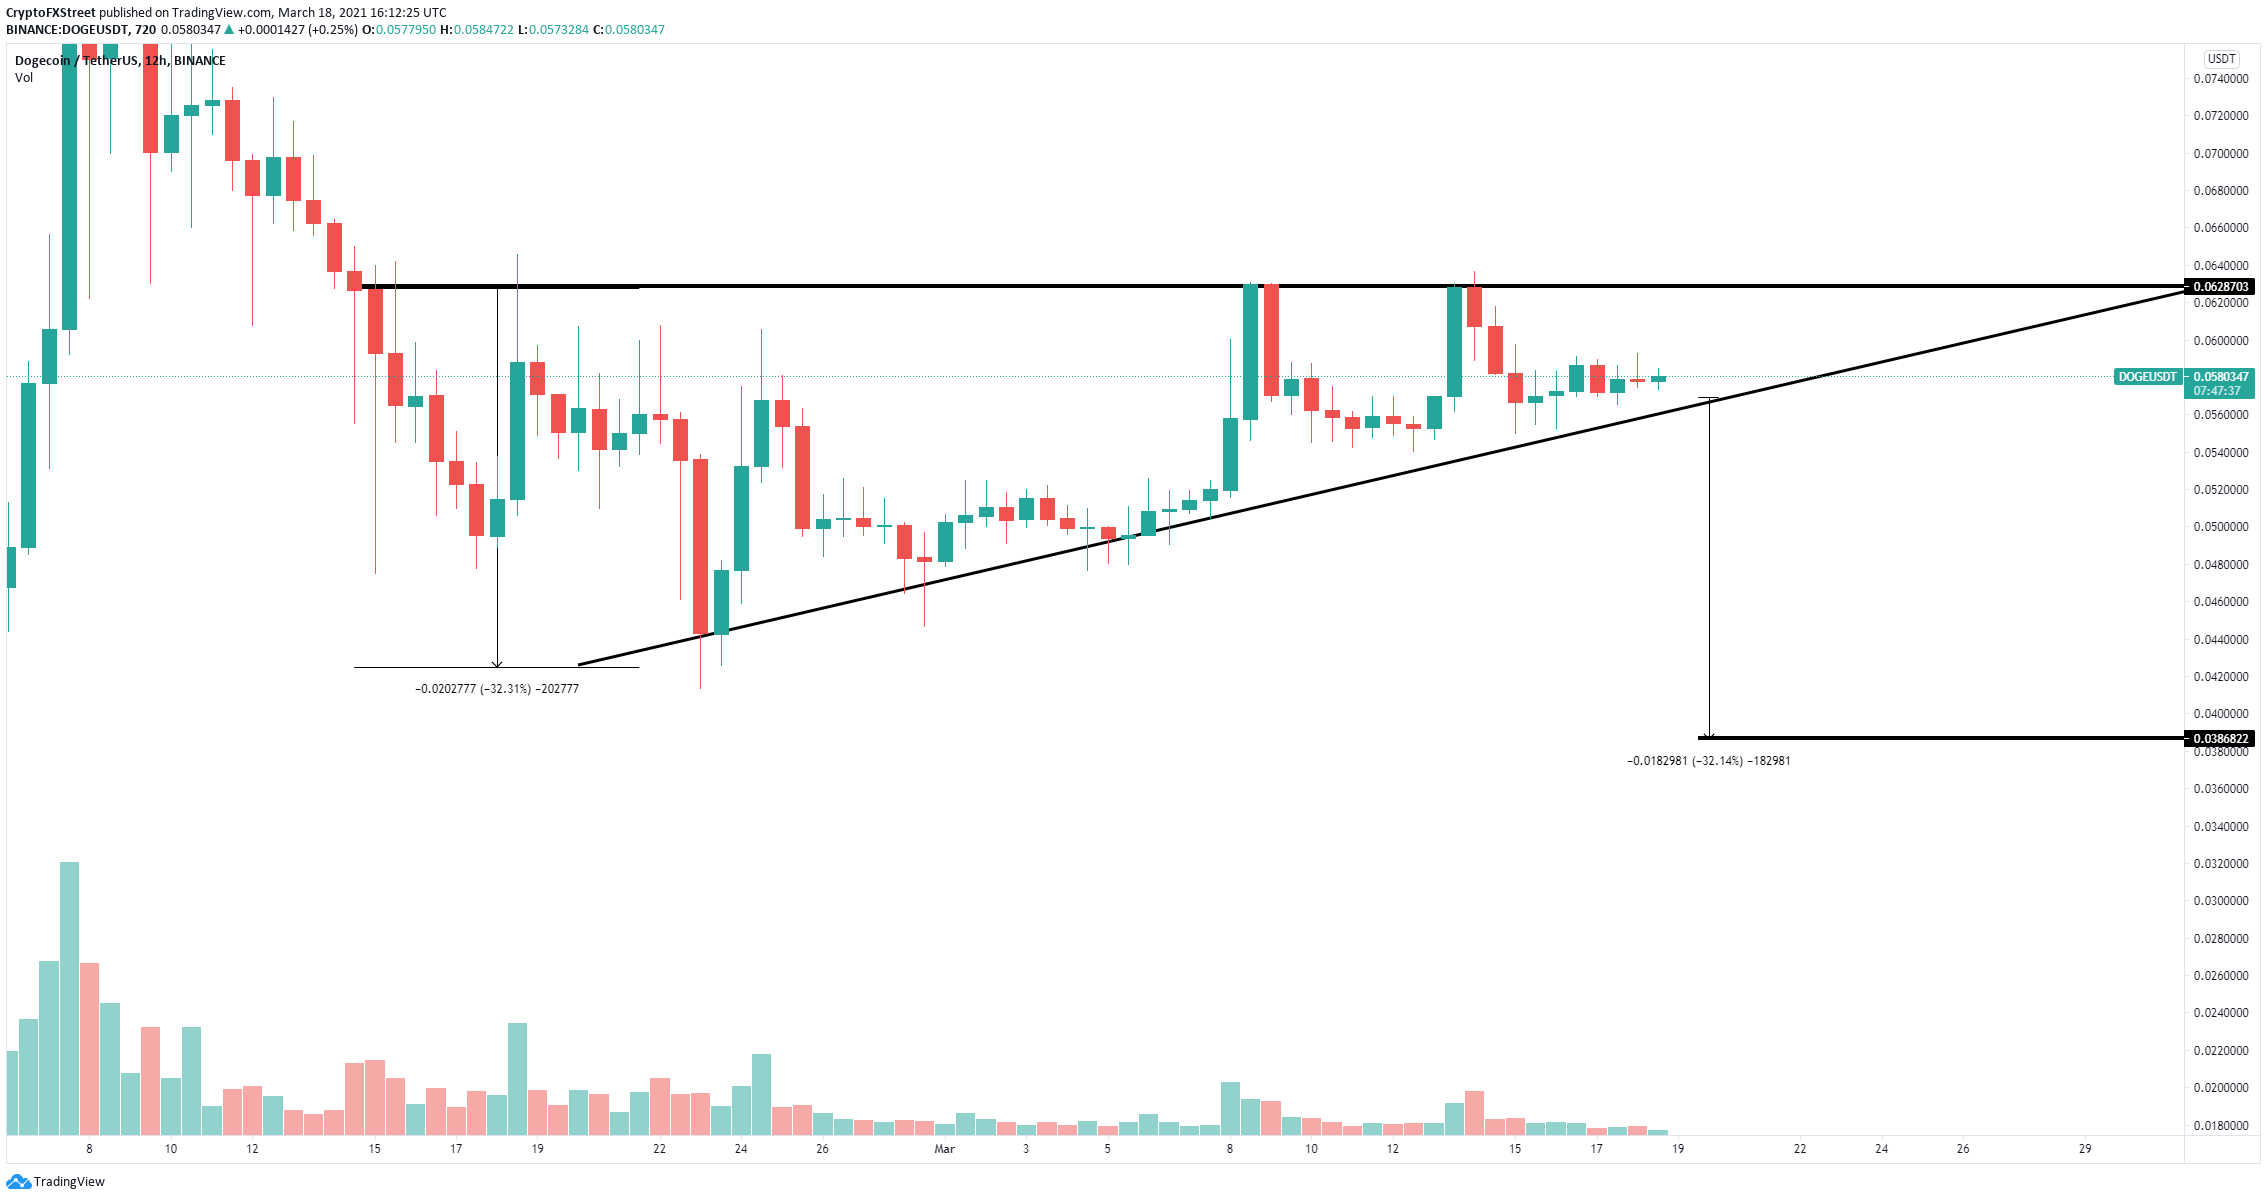
DOGE/USD 12-hour chart
The IOMAP shows strong support between $0.0598 and $0.0562. This area coincides with the lower trendline of the ascending triangle pattern. A breakdown below this point would drive Dogecoin price towards $0.0386 in the long-term.
Author

Lorenzo Stroe
Independent Analyst
Lorenzo is an experienced Technical Analyst and Content Writer who has been working in the cryptocurrency industry since 2012. He also has a passion for trading.


