Dogecoin price at pivotal point where DOGE could return to $0.20
- Dogecoin price maintains support and resistance inside the falling wedge.
- From a probability perspective, the most likely outcome from this pattern is a bullish breakout.
- Downside risks remain, and they are substantial.

Dogecoin price has stubbornly and persistently remained inside the bounds of a falling wedge. Except for a false breakout higher and a false breakout lower in the middle of the month, DOGE has been confined to the trendlines of this bullish reversal pattern.
Dogecoin price action awaits confirmation of a breakout – directional bias is bullish
Dogecoin price is just two days away from reaching the apex of a falling wedge pattern – a pattern confirmed in December 2021. The falling wedge pattern is one of the most potent bullish reversal patterns in Technical Analysis and is heavily slanted towards prices moving higher.
According to Technical Analysis – The Complete Resource for Financial Market Technicians (Kirkpatrick & Dahlquist, 2016), the falling wedge (and rising wedge) is one of the most profitable patterns of all – the publisher highlights a specific point made in the text to reinforce the point and strength of this pattern.
The falling wedge has a requirement that the trendlines of the pattern are touched at least five times – Dogecoin price has done this. A characteristic but not necessarily a rule is that volume declines in the final third of the wedge pattern. Again, Dogecoin price has had a precipitous drop in volume, especially near the apex of the trendlines. For upwards breakouts, failure rates are historically low (8% - 11%).
Volume that increases post-breakout increases this pattern's performance and profitability rate. Conversely, pullbacks and throwbacks are extremely common and harm subsequent performance.
A conservative breakout target for Dogecoin price is the top of the daily Ichimoku Cloud at $0.19, positioning the close above the Tenkan-Sen, Kijun-Sen, and Senkou Span A.
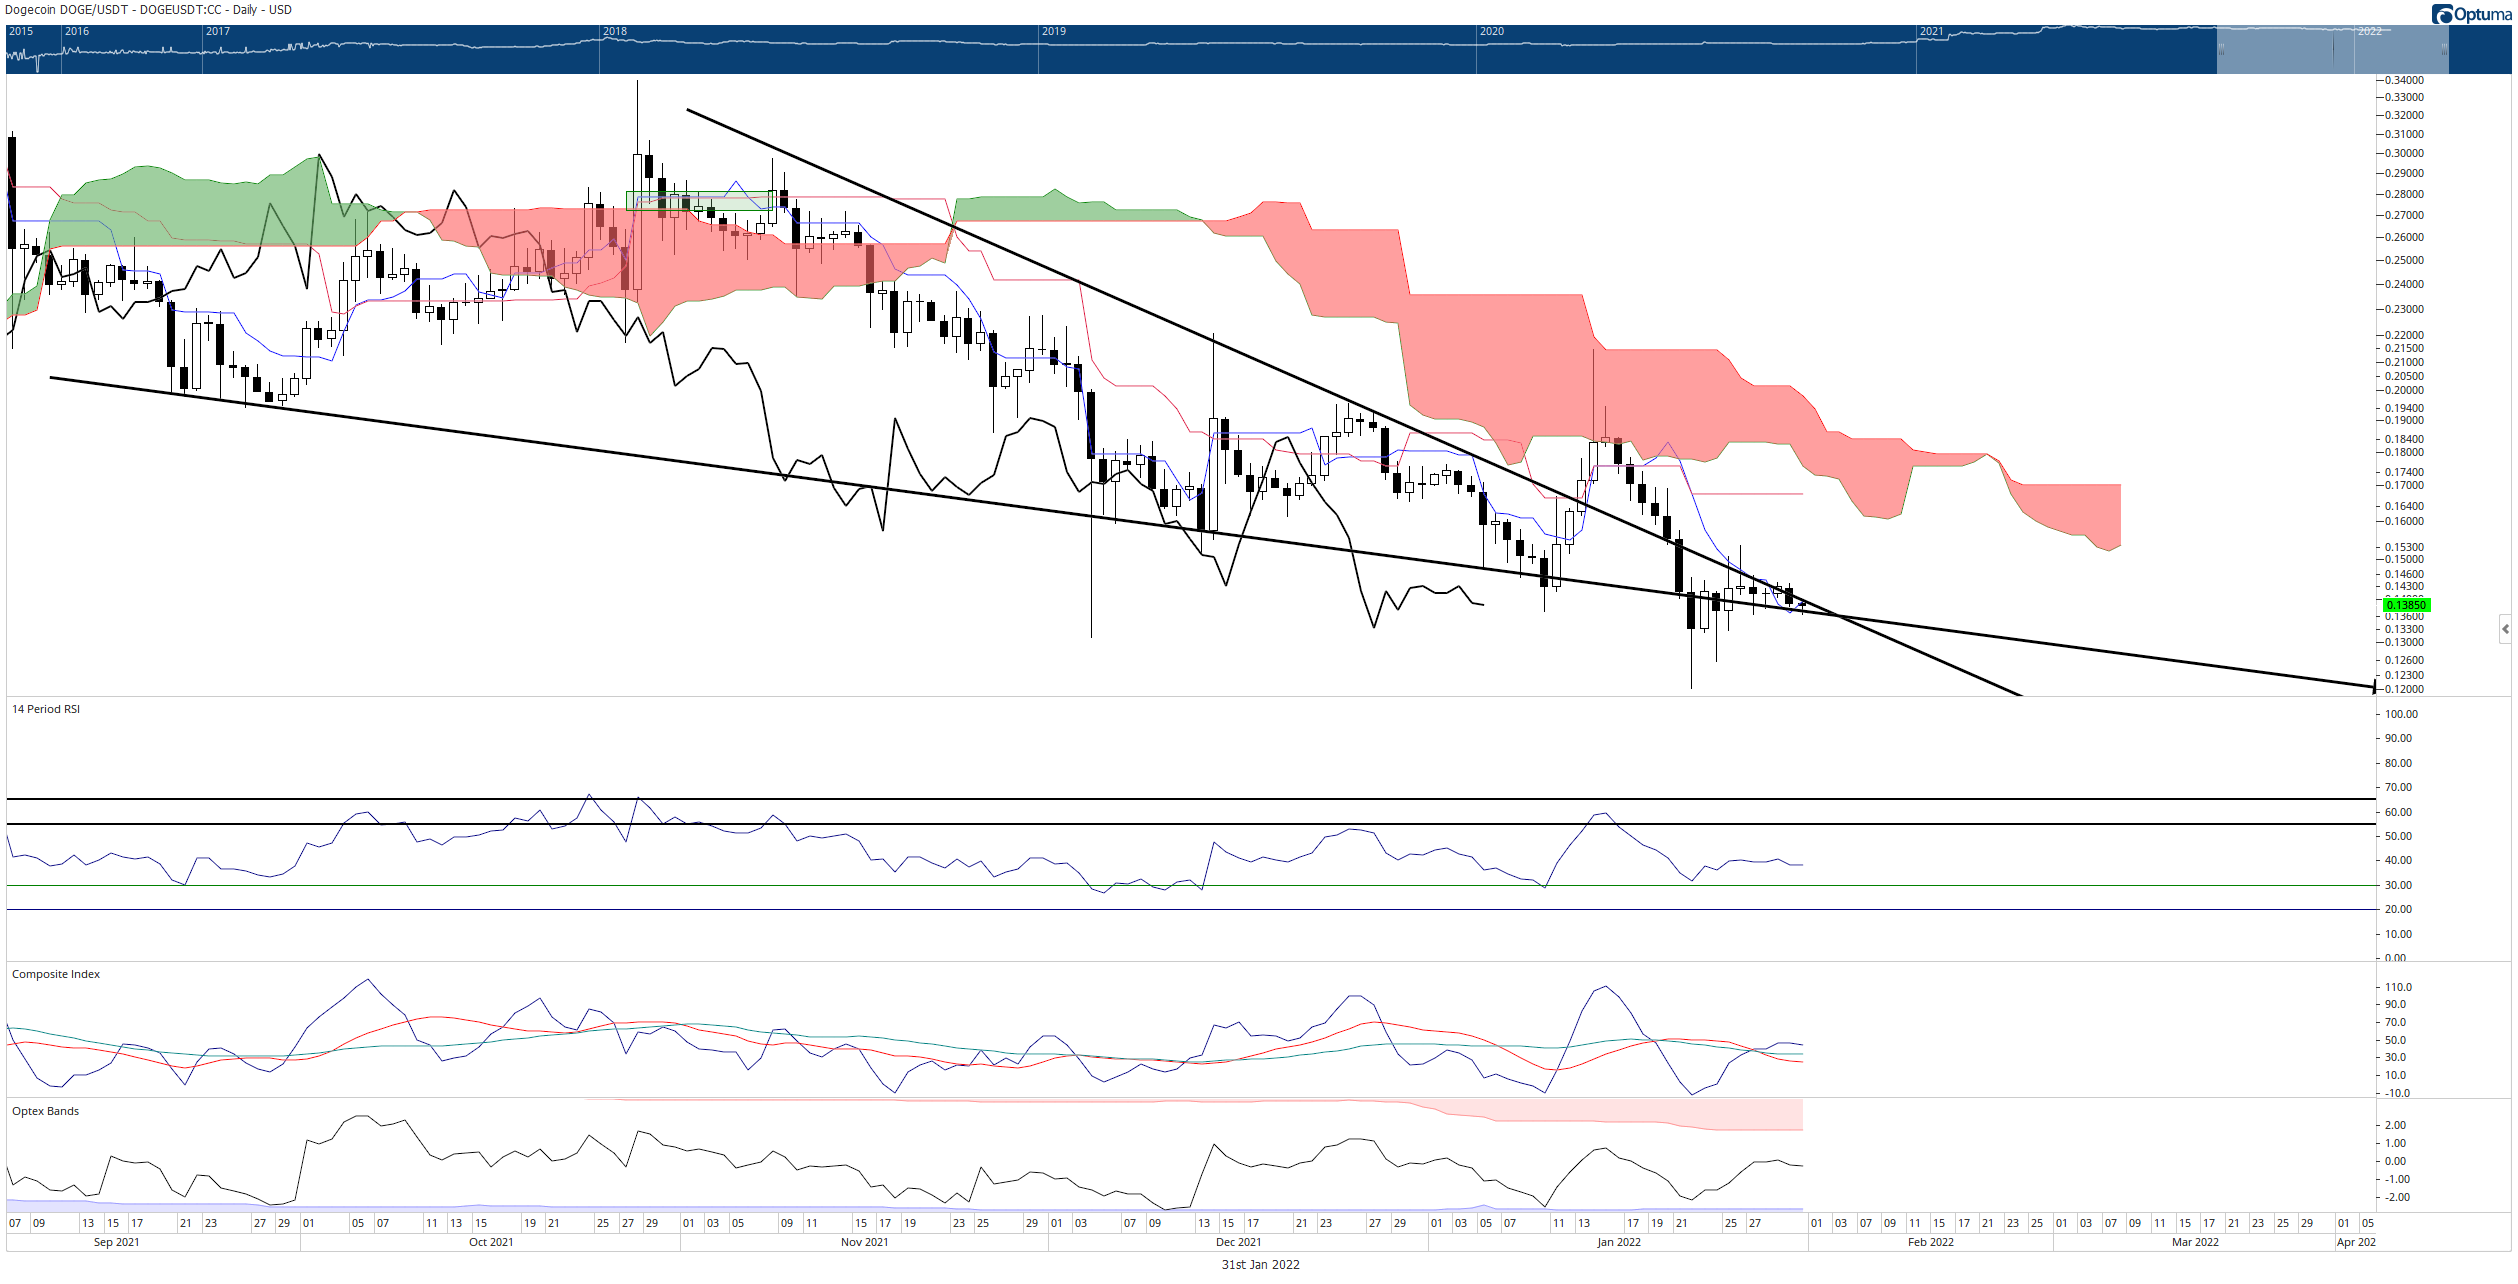
DOGE/USDT Daily Ichimoku Kinko Hyo Chart
However, downside risks remain. The Volume Profile remains precipitously thin between $0.09 and $0.16. Any time spent below the $0.16 value area continues to put Dogecoin price at high risk of a flash-crash into the $0.09 price range.
Author

Jonathan Morgan
Independent Analyst
Jonathan has been working as an Independent future, forex, and cryptocurrency trader and analyst for 8 years. He also has been writing for the past 5 years.



