Data suggests Bitcoin should value at $12000 with current network demand

In brief
Sentiment has generally improved in the cryptocurrency markets as Bitcoin prices reclaimed the $9300 levels.
Data shows that investors have been optimistic about BTC prices on a six-month horizon. Other indicators are showing that BTC should value at $12000 with the current network demand.
Some of the altcoin laggers have been catching up as the rally of DeFi tokens hit a break.
Market Overview
Sentiment has noticeably improved in the broader cryptocurrency market. The prices of bitcoin initially shook off the recent sideways trading, briefly traded above 9300 levels in the early Asia session on Tuesday.
Although BTC’s Tuesday price actions may look insignificant compared to the recent leading DeFi tokens, data shows that medium-term investors seem to remain positive on the leading cryptocurrency.
Data from Sentix shows that Bitcoin’s Strategic Bias has been mostly staying at relatively high levels, and the Bias rebounded to near 0.3 last week. Patrick Hussy, Managing Director at Sentix, said, the number suggests that “positive continuation of the trend in the Bitcoin price can be expected after the current consolidation. Since the short-term sentiment has cooled off as planned in recent weeks, such a continuation of the trend could soon begin.”
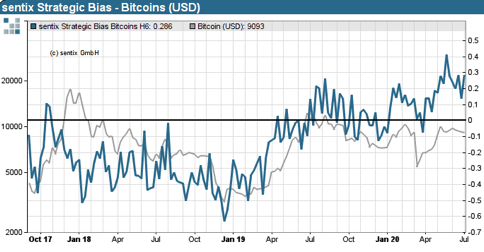
Figure 1: Sentix BTC Strategic Bias (Source: Sentix)
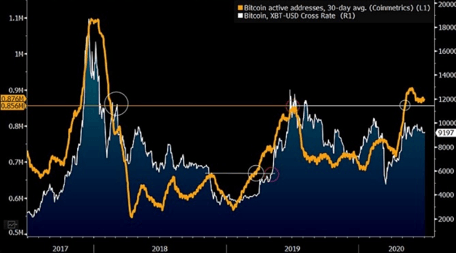
Figure 2: Bitcoin active addresses 30-day average (Source: Bloomberg)
Additionally, the fundamental demand of the bitcoin network could be another factor that could strengthen the positive bias of bitcoin prices in the medium-term perspective.
Data from Bloomberg shows that the 30-day average Bitcoin’s active addresses produced a break out and reached the highest levels since February 2018.This could imply that the fair value of bitcoin should be near $12000 when the 30-day average active address reached nearly 0.85 million.
Of course, other on-chain data and institutional interest could also be in play. However,the active addresses number is considered one of the key signals for the real usage of a network, a key element when it comes to valuation.
Elsewhere, large- and mid-cap altcoins have been catching up. BSV has seen some notable movements, gained 20% while LINK surged more than 16%. On the other hand, the DeFi token bulls seem to look tired, with KNC traded only 2% higher, and COMP gave up 3% value.
July could be an event-packed month for the crypto space, with ADA’s Shelly upgrade continues in focus. Tron watchers don’t want to miss the details about TRX 4.0. Also, BCD’s halving is expected to happen by the end of the month.
Price analysis
BTC/USDT – Bulls could take over from here?
BTCUSDT produced a small daily bullish engulfing pattern. Monday's price action brought the pair back into June's trading range.
Momentum has shown improvement alongside the bullish candlestick pattern, with the MACD produced a bullish crossover despite remaining in the negative zone. Also, the stochastic produced a bullish crossover and trying to break the recent downtrend.
While the sentiment remained mostly positive, and fundamentals seem favorable for the bulls, the pair may retest the support of the 50-day moving average near the 9350 area. If the support there is confirmed, the pair could be able to retest the 23 June high near 9780.
On the other hand, the one-year resistance-turned-support line remained an important lower level to watch, sitting near the 8700 area.
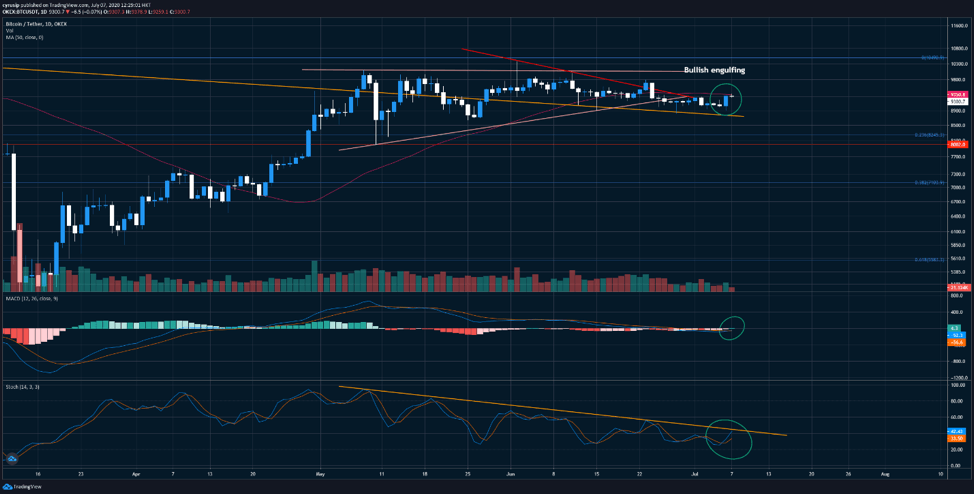
Figure 3: BTCUSDT daily chart (Source: OKEx; Tradingview)
ETH/USDT – Not yet a breakout?
In our last edition of Technical Tuesday, we highlighted the importance of the 78.6% Fibonacci retracement support for ETHUSDT,and we proved that the support at such level was valid.
Monday’s price action also created another leg for the ascending triangle pattern. However, it could be premature to say that a breakout on the upside could be seen at this point since the resistance at the top of the triangle near 250 levels remained solid.
Momentum-wise, therewere some positive developments, with the MACD back in the positive area with a bullish crossover. The MOM indicator has made a trend reversal, signaling that upside momentum has been building up.
With the bias tilted toward the upside, the pair may first retest the psychologically important 250 levels in the short-term, while the area of 227 could be thelower level to watch.
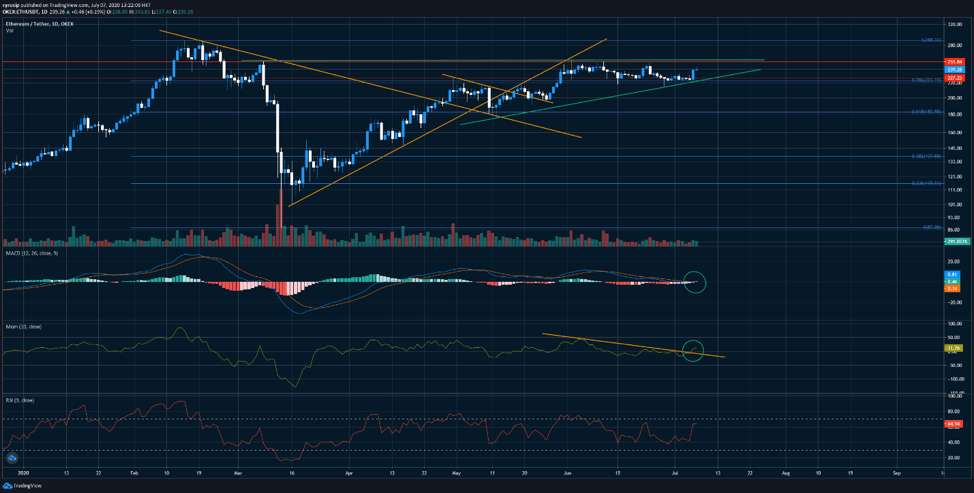
Figure 4: ETHUSDT daily chart (Source: OKEx; Tradingview)
LTC/USDT – Bulls still have room to go?
We also emphasized the chance of having a short-term price rebound on LTCUSDT in our last publication, and a rebound is now confirmed, despite the pair is still mainly within the recent trading range.
The stochastic, the RSI, and the MOM indicators all produced a positive signal. The upside momentum has been gaining traction. However, the trade volume didn't match the price actions and the momentum indicators.
This divergence could mean the price may need further consolidation from here before retesting the channel's upper resistance.
Figure 5: LTCUSDT daily chart (Source: OKEx; Tradingview)
BSVUSDT – Anticipating a long-term weekly rebound?
BSVUSDT produced a strong weekly rebound after reaching the lower support of the long-term channel.
While the 10-week moving average and the 20-week moving average have been getting closer to each other, the 10-week MA could rise above the 20-week MA with the overall improved sentiment in the markets. If a weekly golden cross is confirmed in the coming weeks, it could signal a beginning of a medium/long term uptrend.
Momentum has also seen a significant rebound, with the RSI jumped back to the 50 levels after dipping to below 40,which seems matching with the previous pattern.
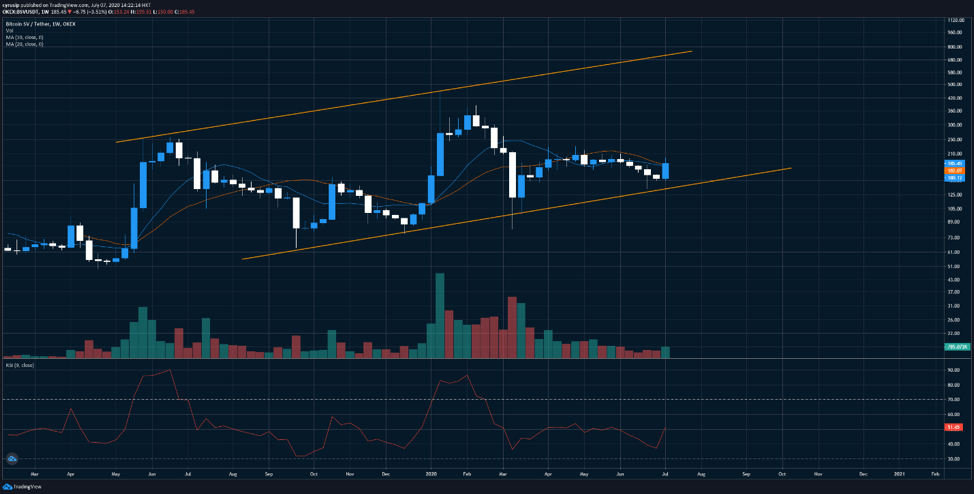
Figure 6: BSVUSDT weekly chart (Source: OKEx; Tradingview)
LINKUSDT – May need consolidations after reaching a new one-year high?
LINKUSDT reached a fresh one-year high on Tuesday and produced a breakout on the upside from the recent channel. However, some signs show that the pair may need to consolidate before the rally continues.
Both the RSI and the stochastic were in the overbought zone, suggesting the downside of the price is now significantly larger than the upside.
The pair has reached the upper Bollinger band, meaning that the price could start to slow down from here.
It's important to see if the pair can turn the upper resistance of the channel to support in the short-term, so 5.2 could be the first level to watch, while the 20-day moving average near 4.6 to 4.7 could be another area to focus.
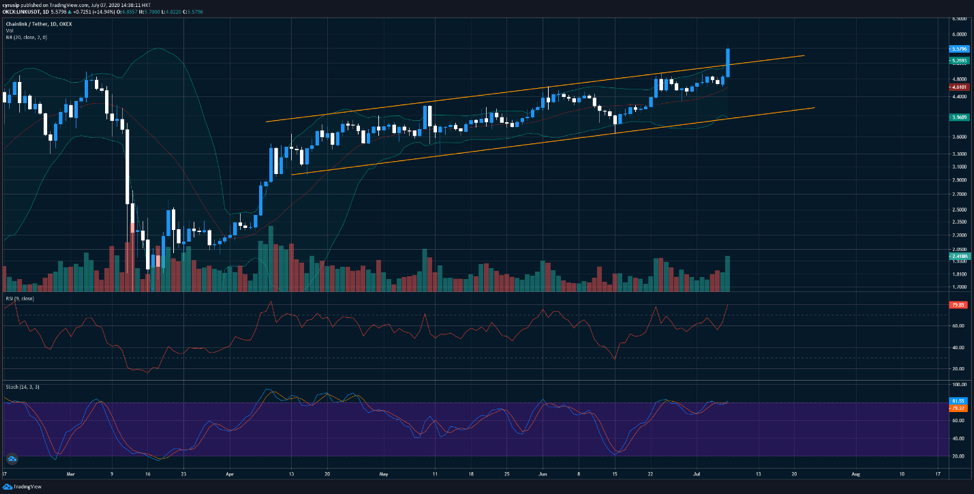
Figure 7: LINKUSDT daily chart (Source: OKEx; Tradingview)
Author

Cyrus Ip
OKEx
Cyrus Ip has the privilege to work with OKEx as a Research Analyst, where he found some of the brightest talents in the crypto space.


