Cryptocurrencies price prediction: Bitcoin, Ethereum & Ripple - 25 June

Bitcoin price prediction: BTC/USD gets ready to a big journey to the North - Bitcoin confluence
Bitcoin (BTC) has resumed the upside and touched $11,340 during Asian hours on Tuesday. The first digital currency has gained over 4% since this time on Monday and grew by 3% since the beginning of the day.
Bitcoin confluence levels
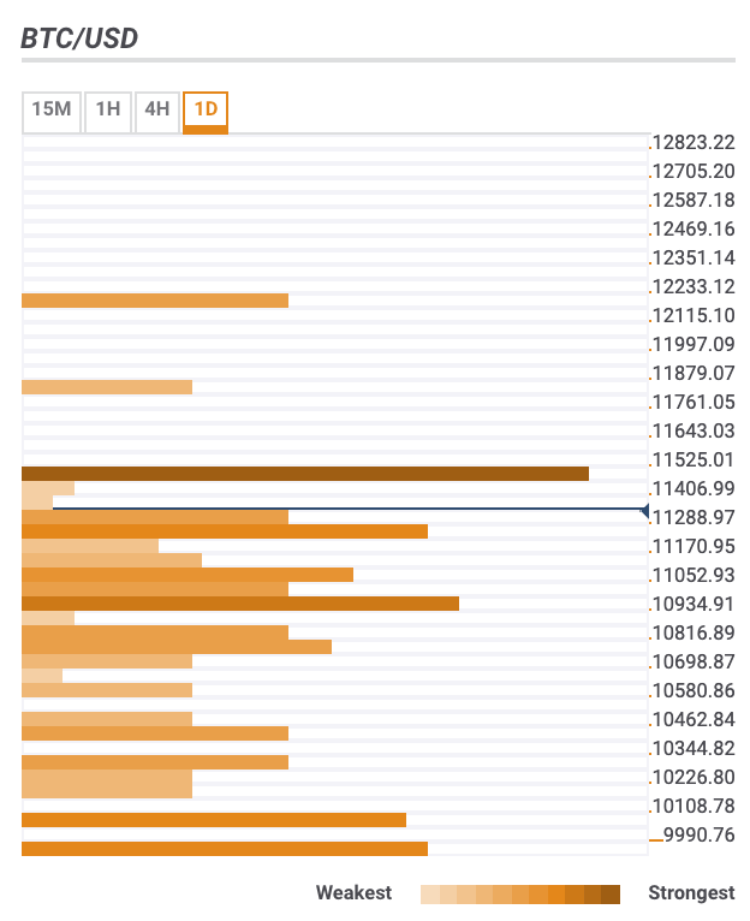
The path to the South is riddled with strong technical levels, while the upside movement promises to be nice and easy once the critical resistance $11,500 is out of the way. Let’s have a closer look at the barriers that might influence Bitcoin’s movements in the short run.
Ethereum (ETH) price analysis: ETH/USD bulls have to clear $320 barrier
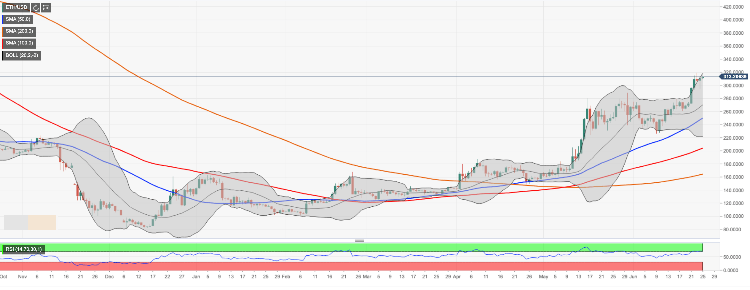
The coin has recovered from Monday’s low of $294 to trade at $313.30 by the time of writing. The second largest cryptocurrency with the current market capitalization of $33.2 billion and an average daily trading volume of $7.9 billion has gained nearly 3% in recent 24 hours and stayed unchanged since the beginning of Tuesday.
Ethereum’s technical picture
Looking technically, a sustainable move above $315.00 (the upper line of 4-hour Bollinger Band) will help to unleash Ethereum’s bullish potential and push the price towards the next upside target $320. Basically, we are entering uncharted territory for the ETH with the next strong barrier created by SMA100 weekly at $381. Once it is cleared, $400.00 will come into view.
Ripple market overview: XRP/USD lags behind Bitcoin and Ethereum as consolidation sets in
Ripple's formidable gains saw it trade above $0.5 level for the first time this year. Although the correction followed in the footsteps of Bitcoin, Ripple gains greatly lagged behind the largest asset which is currently trading closer to its 15-months high.
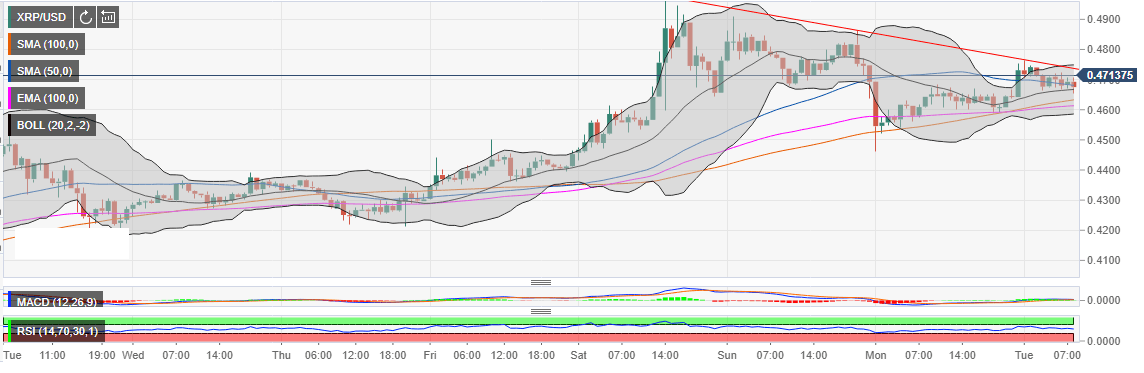
On the other hand, XRP/USD has been forming a higher low pattern from June’s low marginally above $0.3800. Initially, the struggle at $0.4600 capped gains while the downside was supported at $0.4200. The correction above the 50 Simple Moving Average (SMA) and the 100 SMA as well as the 100 Exponential Moving Average (EMA) ignited the momentum as Ripple broke past $0.48 hurdle and eventually climbed above $0.50.
Author

Tomas Salles
FXStreet
Tomàs Sallés was born in Barcelona in 1972, he is a certified technical analyst after having completing specialized courses in Spain and Switzerland. He expanded his technical training following the guidance of great experts on the financial markets.



