Cryptocurrencies finding sellers after Saturday's upward movement

Cryptocurrencies continue retracing after Ethereum (0.98%), and Bitcoin (0.33%) found sellers at critical levels. The most bearish are BitcoinSV (-2.84%), EOS(-2.29%) and ATOM(-3.23%), whereas the most bullish is ZCASH (+8%) and Monero (+3.51%).
The Ethereum-based tokens are following the market retracement, although QNT (+10.26%), SNT(+9.49%), BHT(+18.3%) and, notably, NMR (+57.47%) move quite bullish.

Fig 1 - Crypto Sector Heat Map
The Crypto market cap has dropped from the last $209.19 billion top and is currently at $204.112 billion. But we still consider the market moving in an upward trend, as seen in figure 2, because the upward channel is still held. The 24H volume is currently $34.944 billion. It is slightly below the volume seen in the last week, but it is still influenced by Sunday's low volume. In the previous sessions, Bitcoin has losing steam against other cryptos, especially Ethereum. Thant's why we see a slight drop in its dominance, which is currently 63.91%.
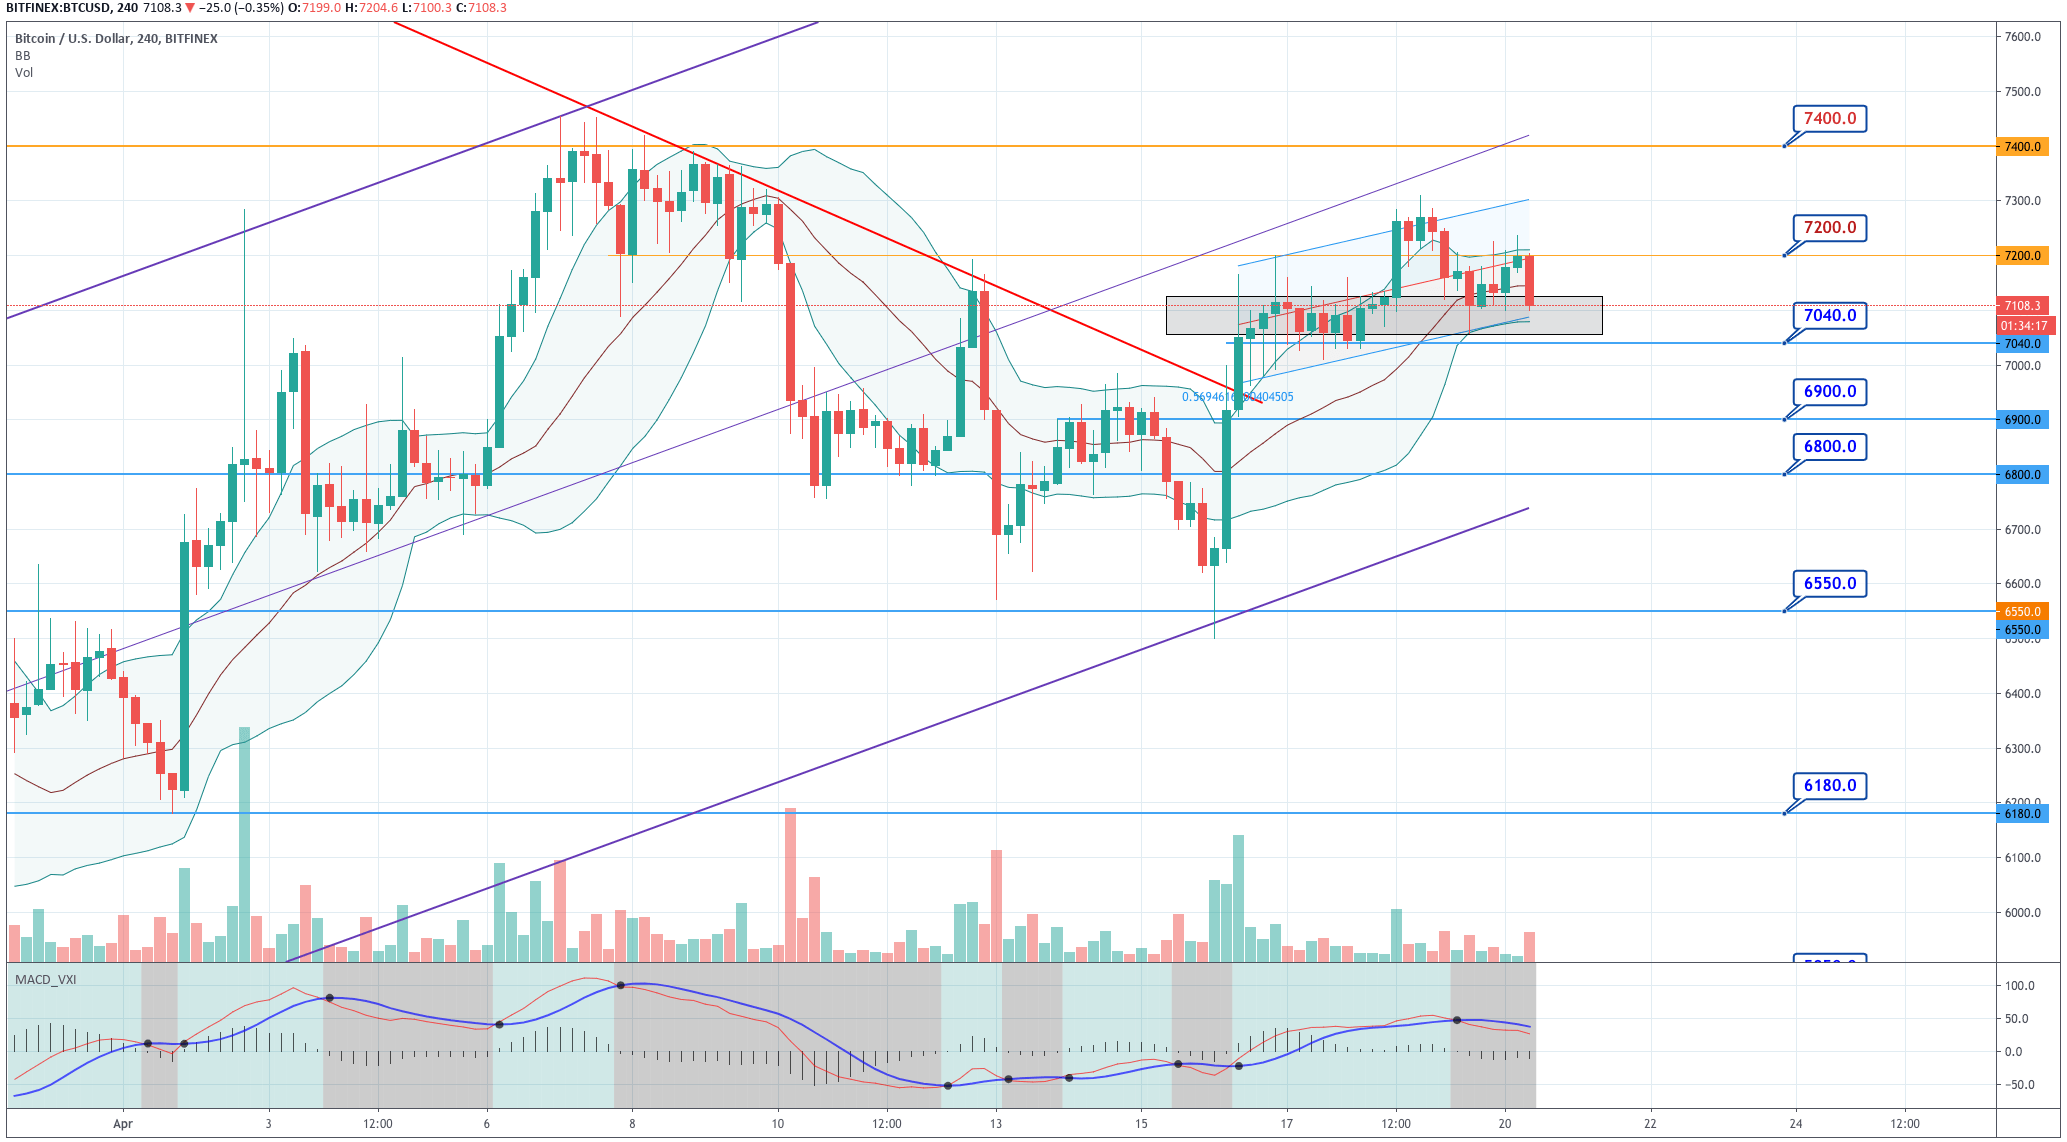
Fig 2 - Total Market Cap Chart
Hot News
Us crude oil fells more than 22 percent, as traders continue worrying about the slump in demand and the high levels of crude oil existences due to coronavirus pandemic. The price dropped below $15 in the afternoon Asian trading, and currently, its futures are traded at $14.17 (-22.7%).
Arrano Capital, a subsidiary of the Hong Kong-based Smart Asia Limited, has launched the first regulated Bitcoin fund. Arrano Capital said the fund tracking Bitcoin's price, will provide institutional investors access to bitcoin using a more traditional fund structure.
Democratic representatives from Ohio and California proposed an offering of ·2,000 monthly paychecks to all Americans over 16 years old. Also, this proposal would offer couples $4,000 per month.
Technical Analysis - Bitcoin
Fig 3 - Bitcoin 4H Chart
Bitcoin is making a large bearish candle that is driving the price inside the consolidation area made last week before the latest upward movement made on Saturday. If there is a close below $7,m040, a small H&S pattern could appear. Trusting H$S patterns is not advisable because they fail more than are right, but at least we should be careful and take it as a warning or a potential turn to the $6,900 level.
MACD has made a bearish transition, and the price is currently in the lower side of the Bollinger Bands, these two signs show the sellers are presently strong. Please note that the last bearish candle is not over, and it will still take 1h 29 min to close.
Standard Pivot Levels
|
SUPPORT |
PIVOT POINT |
RESISTANCE |
|
6,650 |
6,981 |
7,460 |
|
6,171 |
7,790 | |
|
5,843 |
8,272 |
Ethereum
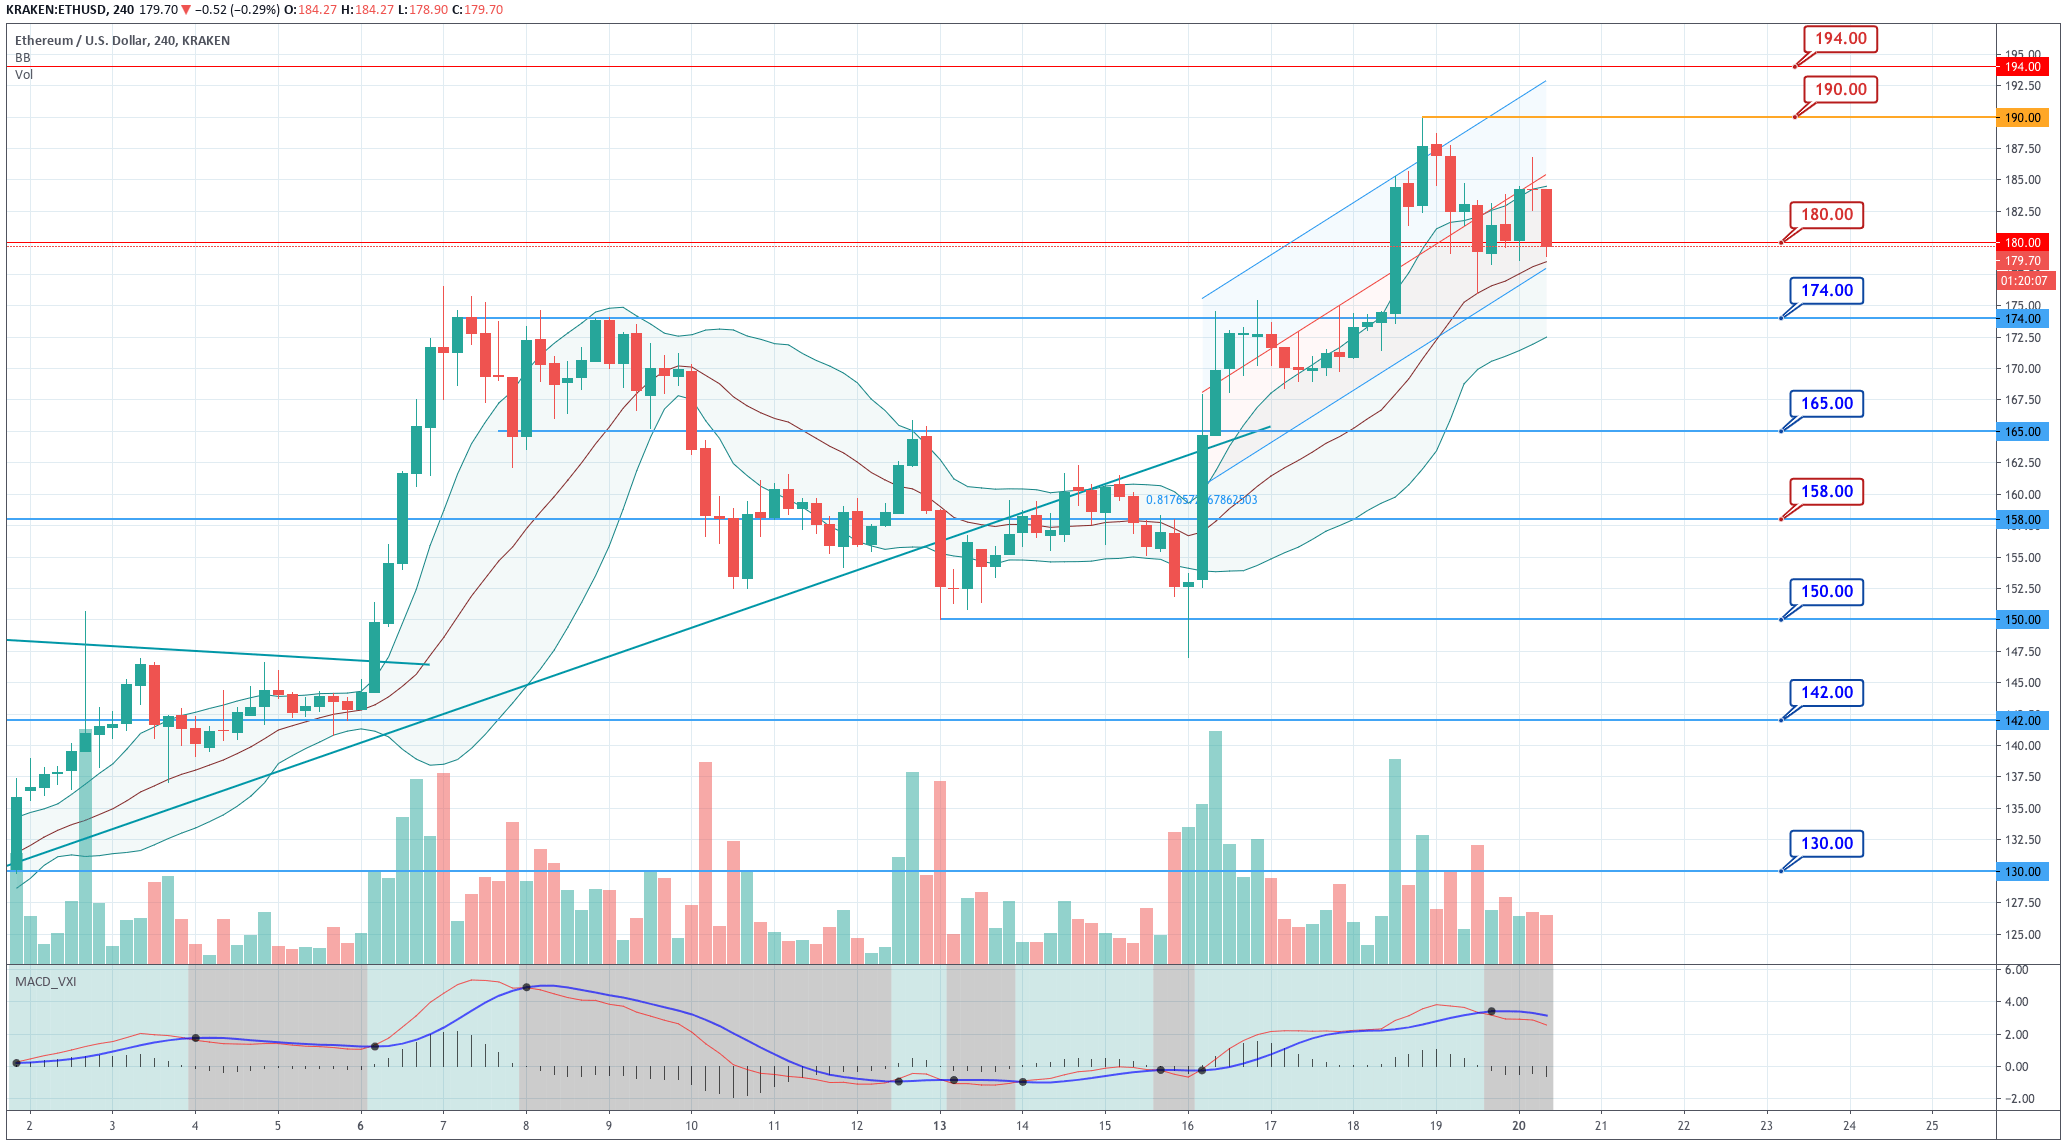
Fig 4 - Ethereum 4H Chart
Ethereum has been leading this bullish leg with substantial gains. That can be seen on the 4H chart, in which we see that the ascending linear regression channel has a steep slope. But, after almost touching the $190 level, the price is sliding, and now it reached the bottom of the ascending channel. We see that the MACD also shows a bearish phase. The current candle still has room to recover, though.
Overall, ETH still shows a healthy bullish bias, so this action can be considered just normal retracement from a critical level.
Standard Pivot Levels
|
SUPPORT |
PIVOT POINT |
RESISTANCE |
|
155.00 |
173.00 |
197 |
|
131.00 |
214 | |
|
114.00 |
239 |
Ripple
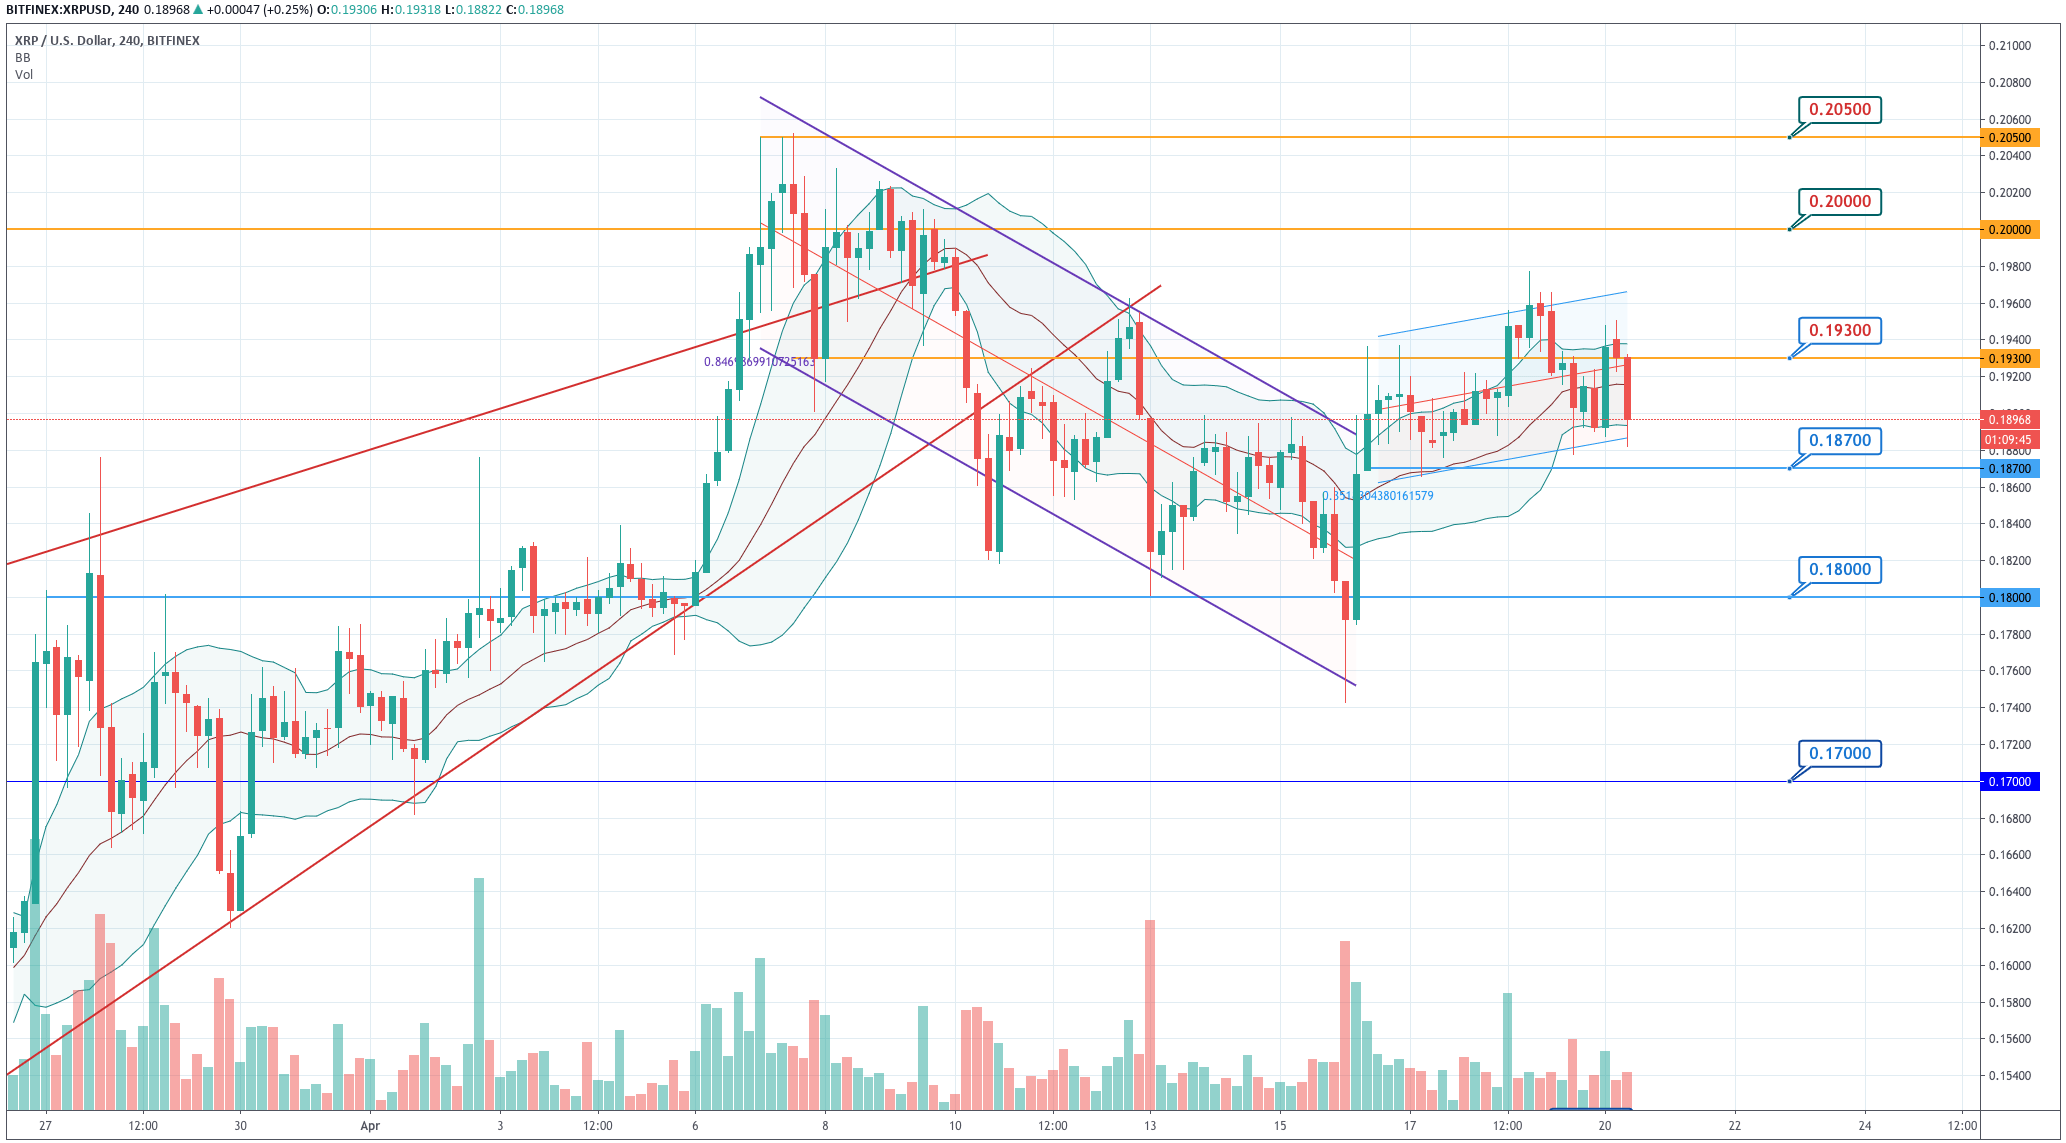
Fig 5 - Ripple 4H Chart
Ripple is moving in an almost horizontal channel after the upward movement made last week. Presently, the price is back to the lower side of the channel. Considering that the previous week could be the start of a new leg up, a bounce from here is to be expected. A failure to do so is useful information for the sellers since it warns that the upward movement could have been a fake. The key level to the downside is $0.187.
Standard Pivot Levels
|
SUPPORT |
PIVOT POINT |
RESISTANCE |
|
0.1761 |
0.1868 |
0.1998 |
|
0.1630 |
0.2104 | |
|
0.1524 |
0.2235 |
Author

EagleFX Team
EagleFX
EagleFX Team is an international group of market analysts with skills in fundamental and technical analysis, applying several methods to assess the state and likelihood of price movements on Forex, Commodities, Indices, Metals and


