Crypto traders gear for President Trump’s plan to tackle inflation, Bitcoin eyes rally above $100,000
- Bitcoin slips to a low of $97,777 on Monday as crypto traders digest Trump’s executive orders and directives to tackle inflation.
- A dent in inflation could increase liquidity and support demand for risk assets like Bitcoin, institutional investors remain bullish.
- BTC eyes return to the all-time high of $109,588, trades near 10% below on Monday.

Bitcoin (BTC) corrects below the $100,000 milestone on Monday, slipping nearly 10% from its all-time high of $109,558 reached on January 20. The largest cryptocurrency by market capitalization has declined to a low of $97,777, even as institutional investors remain bullish on Bitcoin.
Crypto traders keep their eyes peeled for the impact of United States (US) President Donald Trump’s actions and directives to reduce inflation.
Trump signs memorandum and multiple orders to lower prices
President Trump has signed memorandums and orders to lower energy prices and inflation, addressing a key concern among market participants. A Washington Post report says many Americans voted for Donald Trump because he promised to “defeat inflation.”
Trump’s first week in the office included directives focused on bringing “emergency price relief” to Americans for housing, food, gas and other basics. The US President ordered government officials to roll back climate-related policies to slash costs and reduce inflation.
Bitcoin and crypto tokens could benefit from increased liquidity and lower inflation. However, many remain skeptical of President Trump’s actions and their impact on inflation.
Bitcoin drops below $100,000 milestone
Bitcoin has erased nearly 10% of its value relative to its all-time high of $109,588. The token continues to decline and corrects below the $100,000 milestone on Monday. Coinglass data shows that $248.21 million in long positions in Bitcoin have been liquidated in the past 24 hours.
In a daily timeframe, the Relative Strength Index (RSI) and Moving Average Convergence Divergence (MACD) technical indicators signal the likelihood of further correction in the BTC price.
RSI slops downwards and reads 47, while the MACD flashes red histogram bars under the neutral line, suggesting negative underlying momentum in Bitcoin’s price trend.
In the weekly chart, BTC has the potential to recover from its recent decline. The RSI momentum indicator reads 64 and remains out of “overbought” conditions, while the MACD flashes green histogram bars.
Bitcoin could attempt recovery above the $100,000 milestone and gear for a return to the all-time high of $109,588.
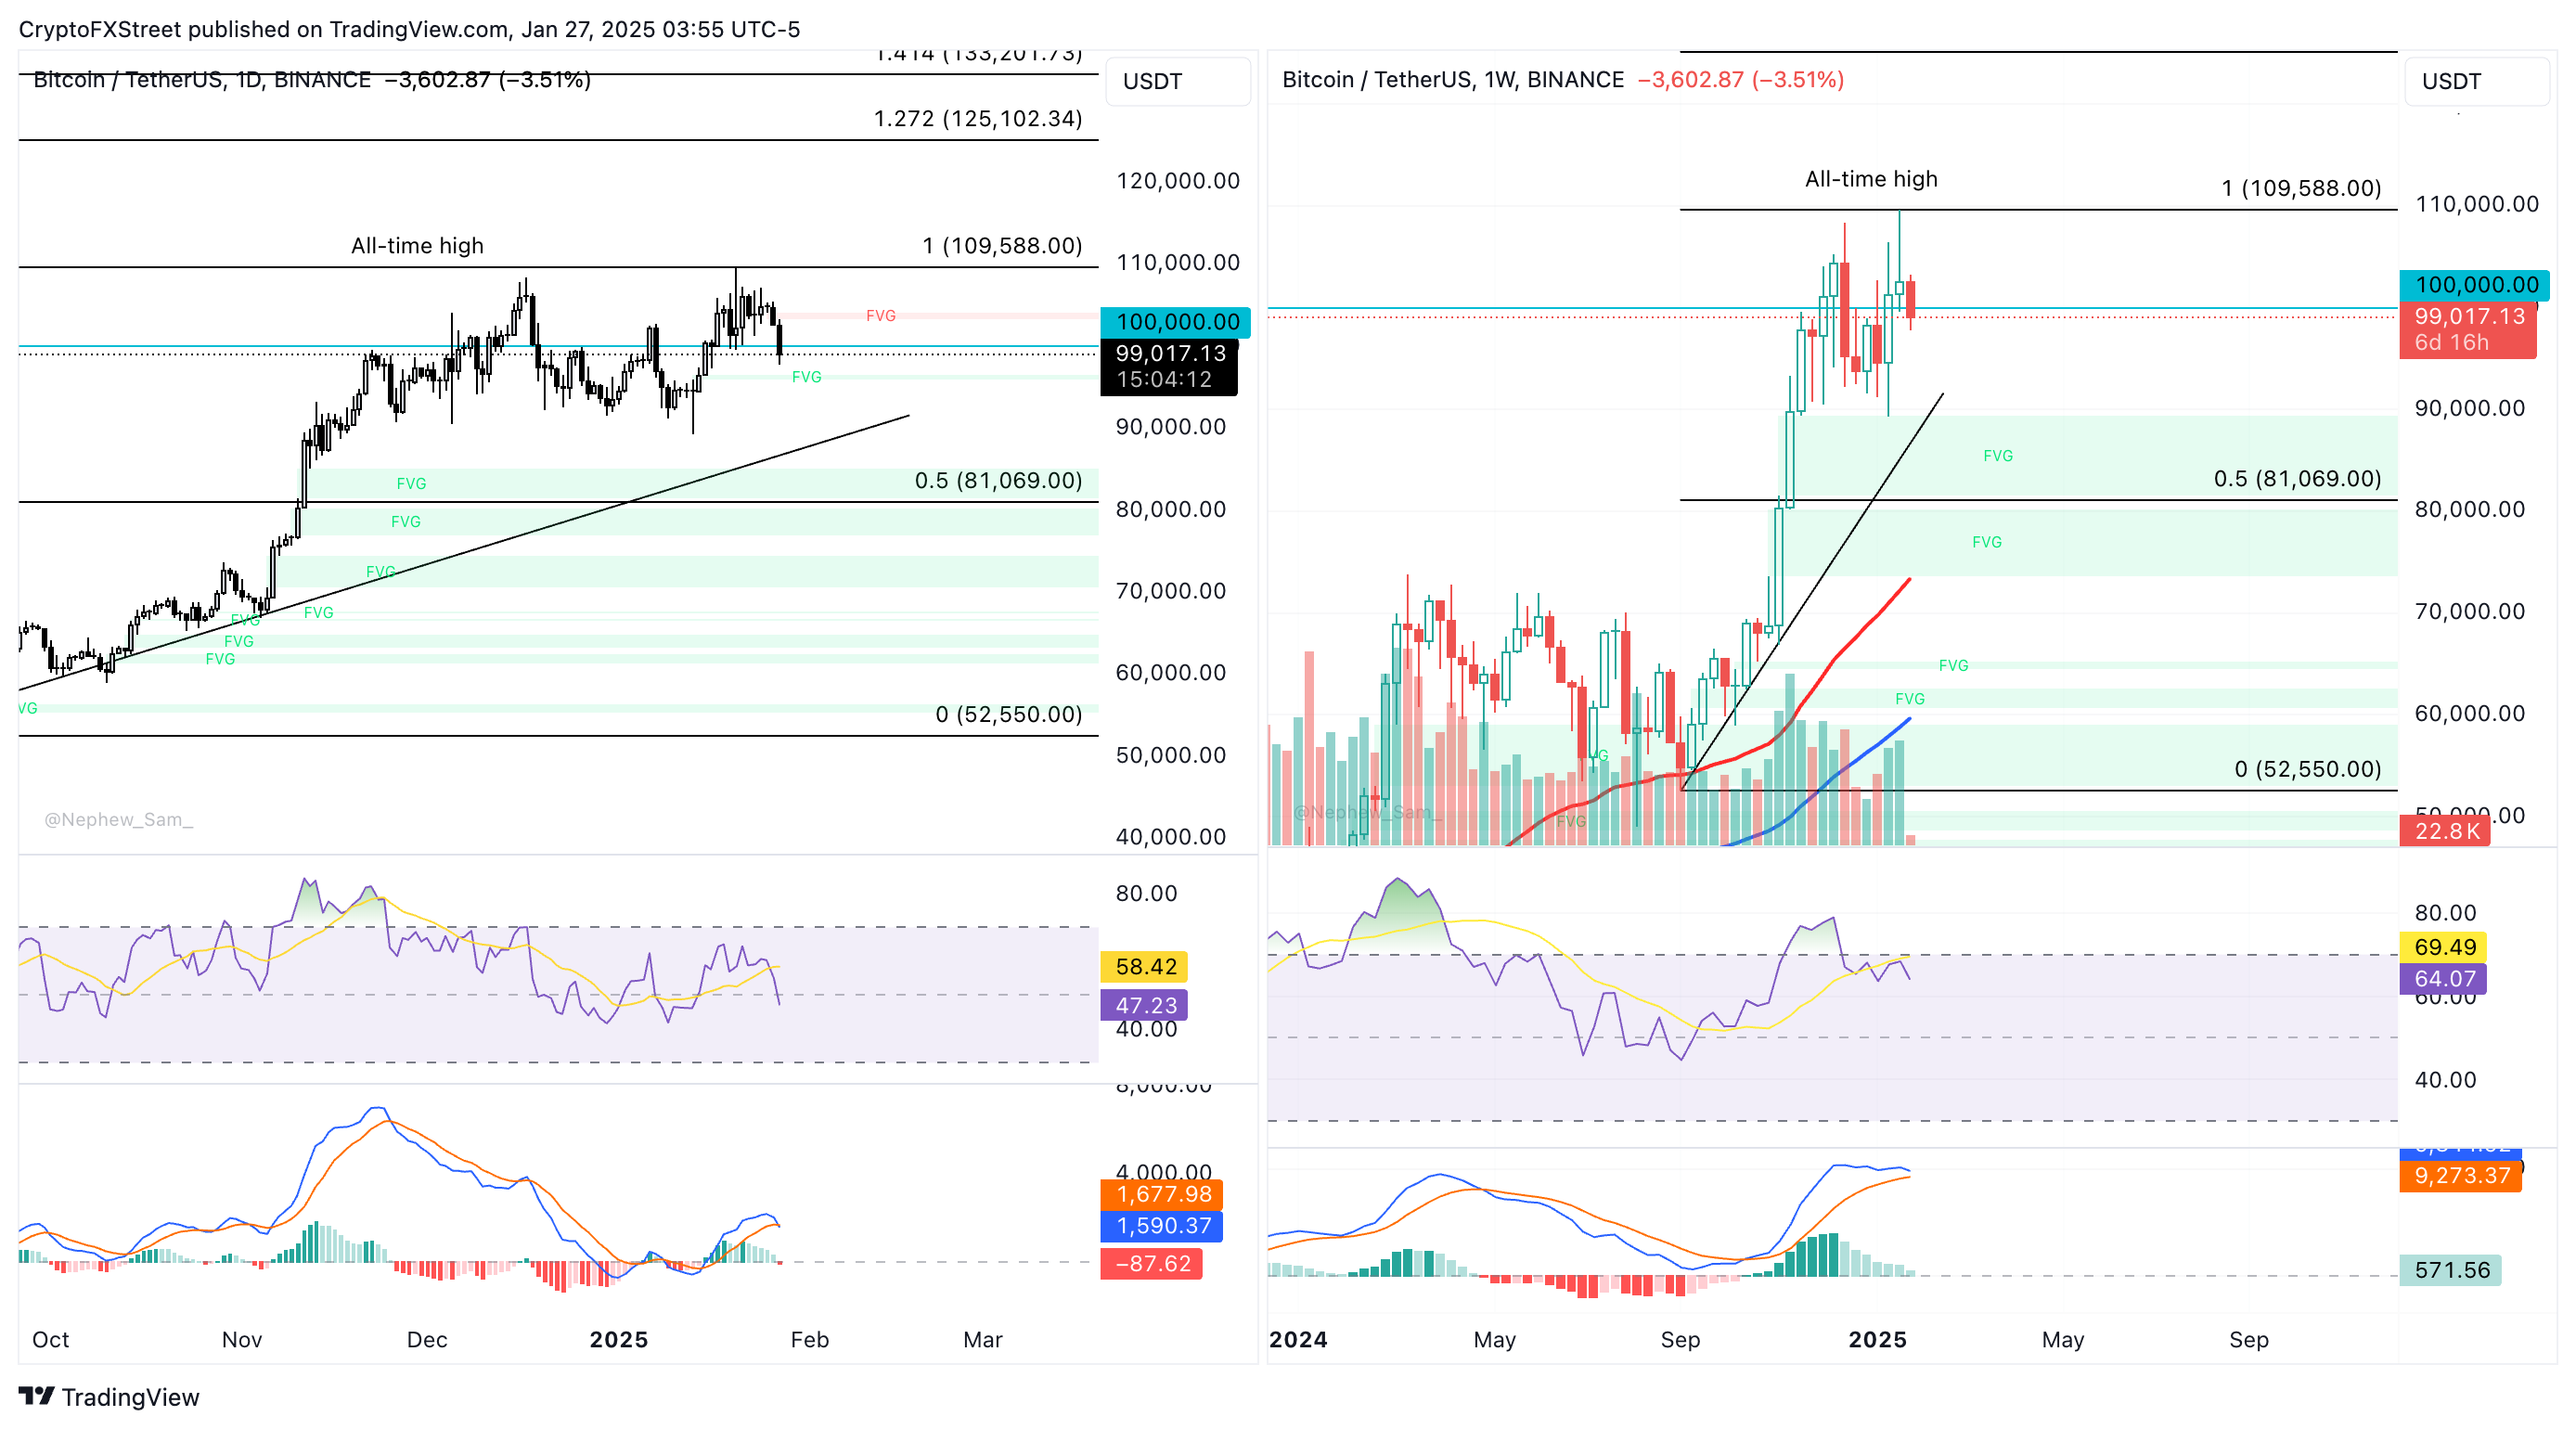
BTC/USDT daily and weekly price chart
Moreover, the long-to-short ratio is an important measure of the sentiment among derivatives traders. With a value above 1 on Binance and OKX, options traders remain optimistic.

Bitcoin derivatives data analysis | Source: Coinglass
It is important to note that institutional investors maintain optimism, with US-based spot Bitcoin Exchange Traded Funds (ETFs) recording a streak of positive net flows for over seven business days, according to Farside Investors’ data.
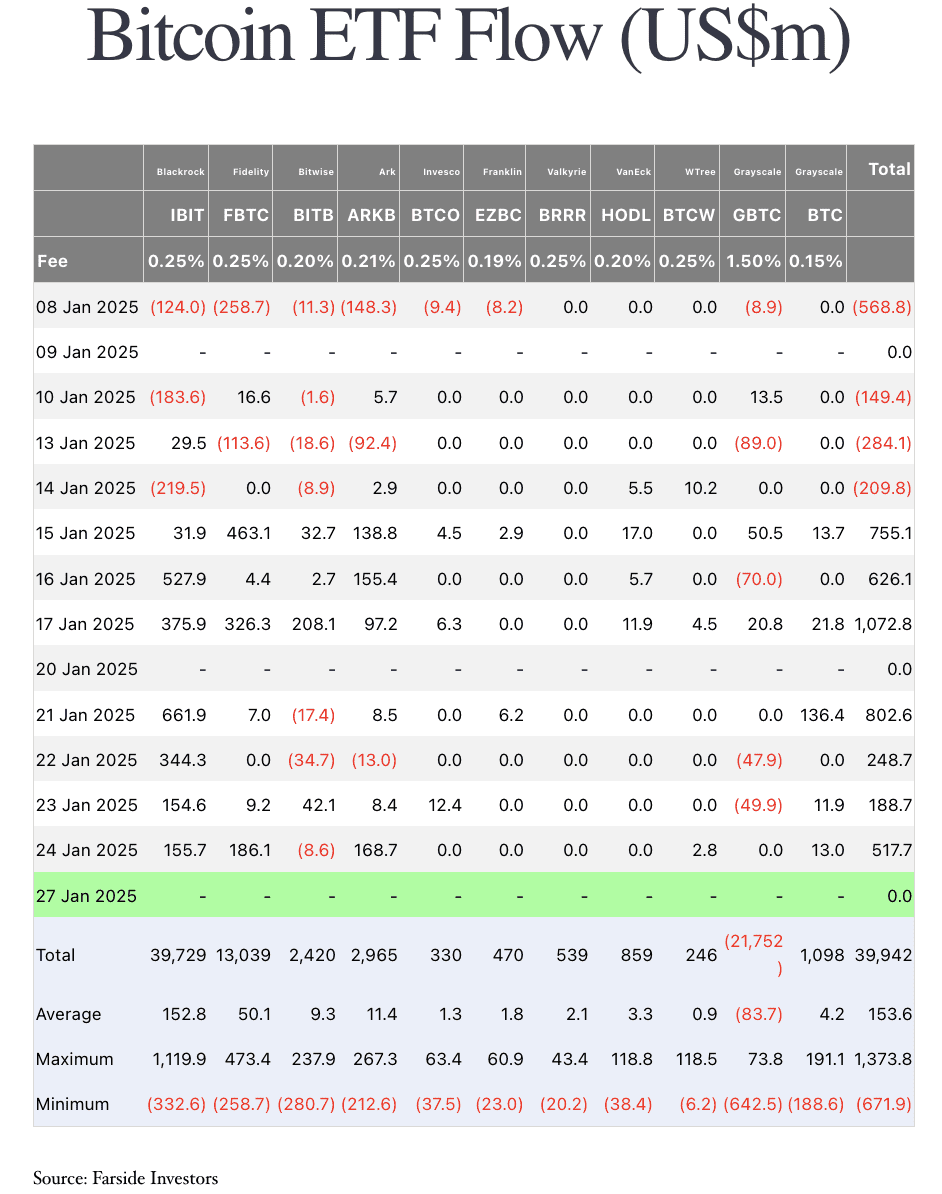
Farside investors inflow data
Bitcoin trades at around $99,000 at the time of writing on Monday.
Author

Ekta Mourya
FXStreet
Ekta Mourya has extensive experience in fundamental and on-chain analysis, particularly focused on impact of macroeconomics and central bank policies on cryptocurrencies.



