Crypto Market Divergences Signal Hidden Strength

Crypto is not for the faint-hearted, and the action of the last 10 days is a case in point …
Last Friday, October 25, just as some Bitcoin investors were throwing in the towel, the King of Crypto turned on a dime. In less than 20 hours, it surged from the $7,500 area to nearly $9,900. And currently, as of early Tuesday,it’s holding most of those gains, trading above $9.400.
These ups and downs in the market are visible to all. What many folk miss, however, is how different sectors of the crypto market lead or lag.
That’s critical; it can make the difference between getting whipsawed and profitably riding the trend.
Last week, for example, theWeiss 50 Crypto Index, which provides the broadest perspective on the market, was up 1.67%; and right now, it’s still roughly flat compared to 10 days ago.
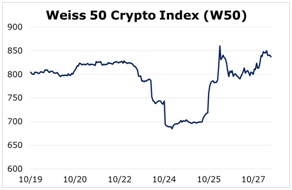
But that belies tremendous volatility: On Thursday night, Oct. 24, the index was down roughly 14% on the week. By Friday night, those losses were largely erased. And currently, like Bitcoin,this index is holding most of its Friday gains.
Here’s the key: To better understand crypto market trends, it’s also important to pay close attention to divergent trends that our crypto price indexes bring to light in other segments of the market.
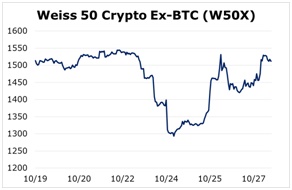
Our Weiss 50 ex-BTC Crypto Index, which excludes Bitcoin, was down 1.45% last week, a small divergence from the Weiss 50 Crypto Index.
More strikingly, the Weiss Small-Cap Index, which covers 73 small-cap cryptocurrencies,rose 6.03% and continued to maintain most of those gains Tuesday morning. That’s a much larger divergence.And as you can see from its chart, unlike the other Weiss indexes, it’s now trading well above last week’s highest levels.
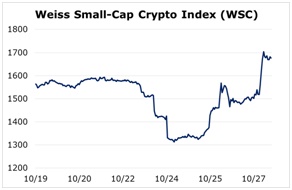
It clearly signals some underlying strength that most investors don’t see.
Looking back further in time, however, we find that it’s Bitcoin’s divergence with larger altcoins thathas provided the most noteworthy clues about the market’s direction.
Specifically, since September, there has been a clear divergence between
-
Most major altcoins, which held well above their September lows and
-
Bitcoin, which last week broke down to new lows in itsmost recent correction.
This is relatively rare. But when it happens, it must not be ignored. It signals that the decline in Bitcoin, such as the one we saw early last week, may not be an accurate representation of the broader market trend. It means that Bitcoin investors should not be so hasty in throwing in the towel becausean important bottom may be in the making.
Indeed, something similar happened almost one year agoin December of 2018. Much as we witnessed last week, the larger altcoins displayed a stronger chart pattern. Theysignaled a bottom. And they went on to lead the entire market much higher in the spring of this year.
That critical divergence in late 2018 was a very good sign for crypto. A similar divergence today may turn out to be an equally good signfor the weeks ahead.
Author

Juan Villaverde
Weiss Crypto Ratings
Juan Villaverde is an econometrician and mathematician devoted to the analysis of cryptocurrencies since 2012.


