Cosmos price trades in a clear downtrend with 5% losses in sight
- Cosmos price is consolidating below the confines of a descending trend line as the $10.69 support level holds.
- ATOM price action has led to the formation of a descending triangle on the four-hour chart, with 5% losses underway.
- A decisive four-hour candlestick close above the $11.52 resistance level, however, would invalidate the bearish thesis.

Cosmos (ATOM) price has displayed considerable volatility since mid-April, recording massive losses as investors saw all the gains made during the first half of the fourth months slip through their fingers. The volatility came as Bitcoin tried to navigate the tailwinds and headwinds of US macroeconomics and the overall bear market. The entire crypto playing field suffered the aftermath due to BTC dominance.
Also Read: Top 3 Price Prediction Bitcoin, Ethereum, Ripple: Panic sellers likely to regret soon
Cosmos price eyes 5% in losses
Cosmos price has been recording a series of lower highs and lower lows since mid-April, with the critical support level at $10.69 holding steady. This price action has led to the formation of a descending triangle chart pattern that could see ATOM holders suffer more losses.
A descending triangle is a bearish continuation chart pattern where the price action trades in a clear downtrend, with a series of lower lows and lower highs. The sellers, currently in control of Cosmos price action, take a temporary pause to consolidate their most recent gains before extending the downtrend lower.
A break below the supporting line at $10.69 would activate the pattern, offering traders two options for entry:
- Dip into the market immediately after the breakout candle closes, or
- Wait for a potential pullback in Cosmos price
ATOM was auctioning at $10.97 at press time, a daily rise of 0.11% with a 24-hour trading volume decrease of 15%. This is evidence of investor uncertainty as crypto markets await the US Retail Sales report scheduled for May 16 and its impact on Bitcoin (BTC) price.
Considering the governing chart pattern is bearish, an increase in seller momentum could see Cosmos price drop toward the base of the descending triangle at $10.69. Such a dropdown could open the drains for another descent to the $10.33 swing low, denoting a 5% downswing from the current price.
The Parabolic SAR supports the dwindling thesis for Cosmos price, still negative after flipping bearish and moving above the price around May 14. This also favors the downside. Further, the Relative Strength Index (RSI) is moving downward toward the midline. ATOM’s downward trajectory will gain momentum once the RSI crosses the neutral line into the negative region.
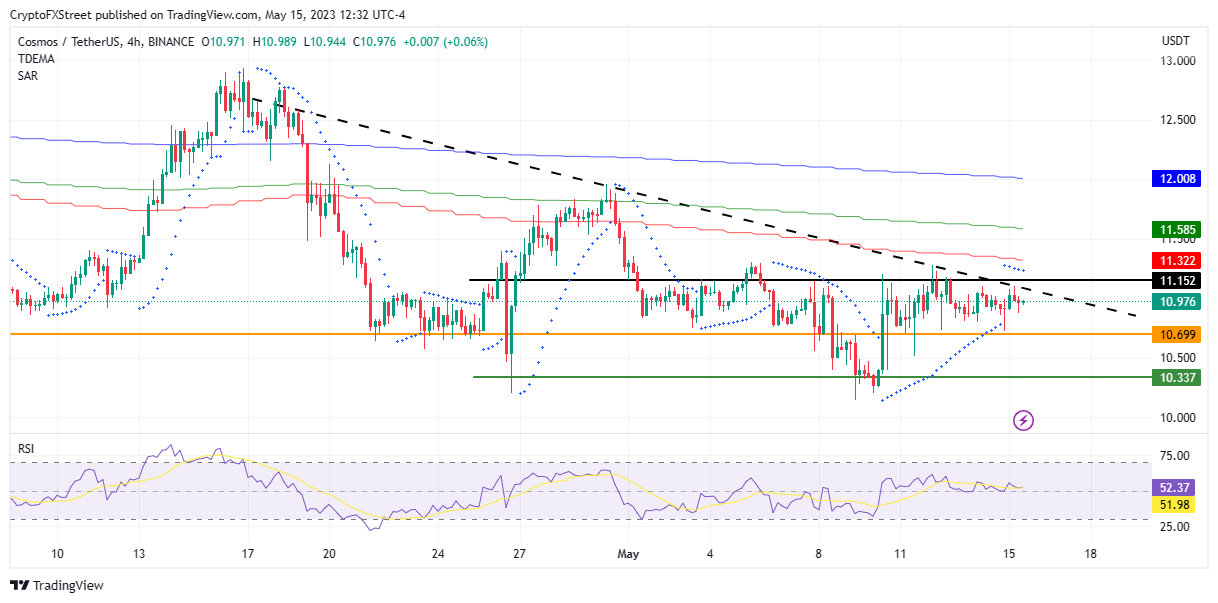
ATOM/USDT 4-hour chart
Conversely, if buyer momentum increases, Cosmos price could break above the downtrend line of the governing pattern. A decisive candlestick close above this technical formation at $11.15 would invalidate the bearish thesis.
Further north, Cosmos price could extend to tag the supplier congestion zones due to the 50- and 100-day Exponential Moving Averages (EMA) at $11.32 and $11.58, respectively, and in a highly bullish case, the 200-day EMA at $12.00.
Author

Lockridge Okoth
FXStreet
Lockridge is a believer in the transformative power of crypto and the blockchain industry.




