Compound price poised for 20% rally following positive on-chain data
- Compound price faces resistance at the 100-day EMA; a break above it signals a bullish move.
- On-chain data shows that COMP's daily active addresses and open interest are rising, suggesting a bullish move on the horizon.
- A daily candlestick close below $46.25 would invalidate the bullish thesis.

Compound (COMP) price is encountering resistance at the 100-day Exponential Moving Average (EMA) at $53.84. As of Wednesday, it trades slightly lower by 0.8% at $52.3. Meanwhile, rising daily active addresses and open interest in on-chain data suggest a bullish move may be imminent.
Compound price eyes for a rally after breaking above 100-day EMA
Compound price is encountering resistance near the 100-day Exponential Moving Average (EMA) at approximately $53.84. This level aligns closely with the daily resistance level at $52.57, thus marking it as a crucial barrier for further upward movement. As of Wednesday, Compound price trades slightly lower by 0.8% at $52.34.
If COMP closes above the 100-day EMA level at $53.84, it could rally 20% to retest its weekly resistance at $63.88.
This bullish outlook is reinforced by the Relative Strength Index (RSI) and Awesome Oscillator (AO) on the daily chart, comfortably above their neutral levels of 50 and zero, respectively, signaling strong bullish momentum.
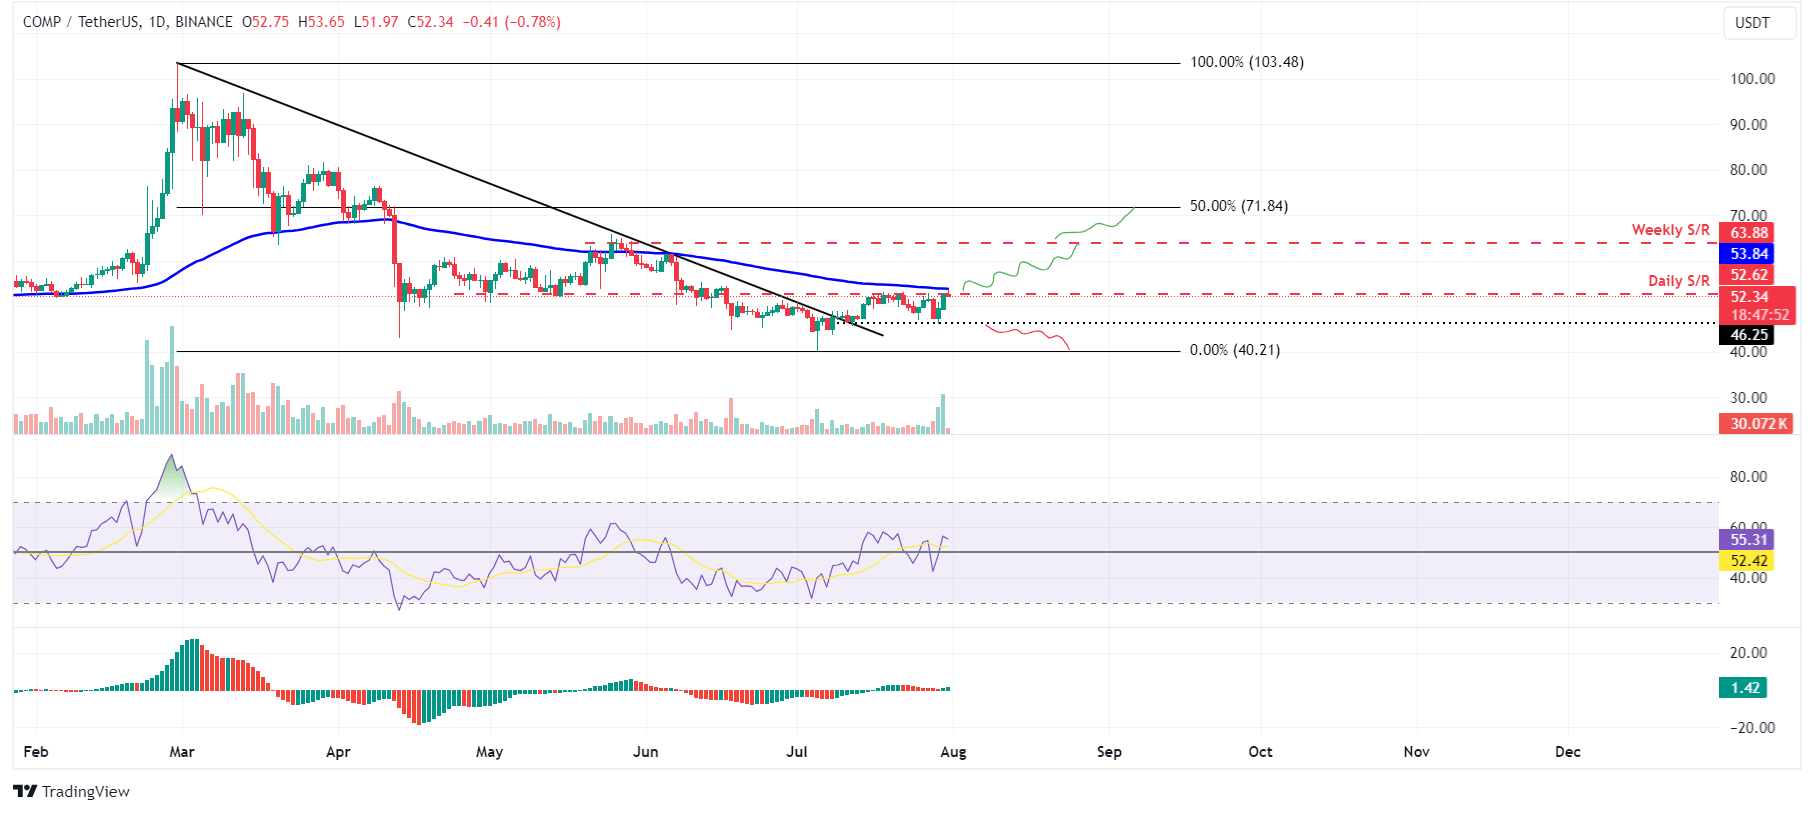
COMP/USDT daily chart
Santiment's Daily Active Addresses index, which helps track network activity over time, aligns with the bullish outlook noted from a technical perspective. A rise in the metric signals greater blockchain usage, while declining addresses point to lower demand for the network.
In Compound's case, Daily Active Addresses have risen from 235 on July 27 to 568 on July 29, the highest since February. This indicates that demand for COMP's blockchain usage is increasing, which could propel a rally in Compound's price.
%20[10.17.56,%2031%20Jul,%202024]-638580018837557352.png)
COMP Daily Active Addresses chart
Data from CoinGlass shows that the future's Open Interest (OI) in COMP at exchanges is increasing. The OI indicates the total number of outstanding derivative contracts that have not been settled (offset by delivery) and whether money flows into the contract are increasing or decreasing.
Increasing OI represents new or additional money entering the market and new buying, which suggests a bullish trend. When OI decreases, it is usually a sign that the market is liquidating, more investors are leaving, and the current price trend is ending.
The graph below shows that COMP's OI increased from $22.11 million on Monday to $32.24 million on Tuesday, indicating that new or additional money is entering the market and new buying is occurring.
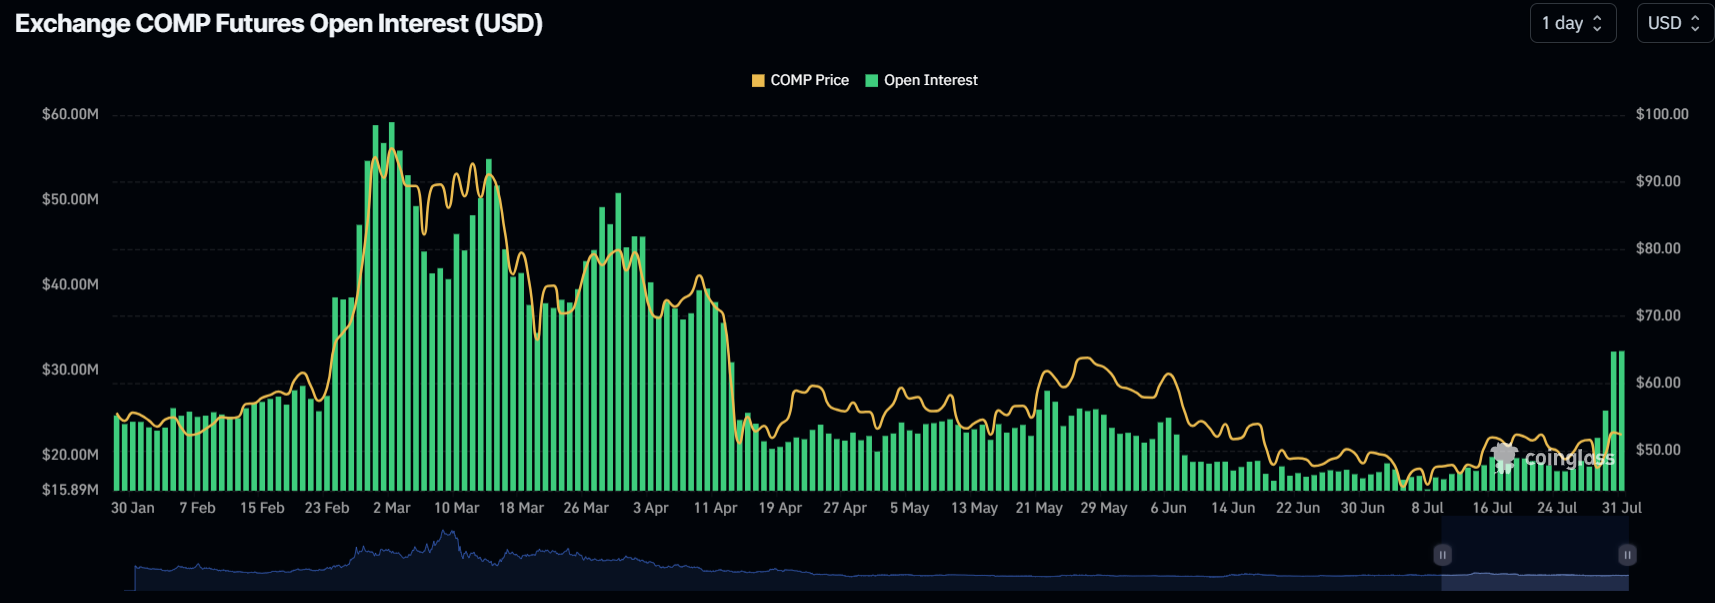
COMP Open Interest chart
Even though on-chain metrics and technical analysis point to a bullish outlook, if Compound's price makes a daily candlestick close below $46.25, the bullish thesis would be invalidated by creating a lower low on the daily chart. This development could see COMP's price decline by 14% to retest its daily low of $40.21 from July 5.
Author

Manish Chhetri
FXStreet
Manish Chhetri is a crypto specialist with over four years of experience in the cryptocurrency industry.


