Chainlink supply on exchanges hits six-month low, fueling LINK price recovery thesis
- Chainlink supply on exchanges dropped to a six month low, signaling declining selling pressure on LINK.
- On-chain metrics like LINK addresses with balance and exchange supply support a bullish thesis for Chainlink price recovery.
- LINK price could wipe out losses from past week and rally towards its $15 target.
-637336005550289133.jpg)
Chainlink (LINK) price fell nearly 11% in the past week amidst speculation of Bitcoin Spot ETF rejection by the US Securities and Exchange Commission (SEC). The blockchain oracle token’s on-chain metrics paint a bullish picture for LINK price recovery this week.
A decline in Chainlink’s supply on exchanges and a rise in total wallet addresses could help LINK erase some of its weekly losses, and begin a recovery.
Also read: Bitcoin Spot ETFs could get SEC greenlight soon, BTC price rally to $45,000 likely
Chainlink on-chain metrics support gains
The altcoin’s supply on cryptocurrency exchanges has hit a six-month low at 8.46% of the total Chainlink supply, according to data from Santiment, a crypto on-chain and social media market tracker. The exchange flow metric aligns with declining exchange supply as it shows outflows of LINK tokens from crypto exchanges in early January.
Typically, a decrease in exchange supply is interpreted as reduced selling pressure on the asset. This on-chain metric, therefore, supports the recovery thesis.
 [11.37.22, 08 Jan, 2024]-638402968757212156.png)
Chainlink supply on exchanges as a percentage of the total supply. Source: Santiment
The 30-day Market Value to Realized Value (MVRV) metric lends credence to the bullish outlook presented by on-chain metrics. The MVRV ratio helps determine the average profit or loss of investors who acquired LINK over the past month.
Based on Chainlink’s history, a drop below the zero line is the opportunity zone for the asset. Currently, the 30-day MVRV for LINK is at negative 10.63%, as seen on Santiment. This suggests that 10.63% of investors who purchased LINK in the past thirty days are sitting on unrealized losses. This supports the recovery of the asset since it is not typical for traders to realize losses.
 [12.00.24, 08 Jan, 2024]-638402969108555067.png)
MVRV ratio and price. Source: Santiment
Total LINK addresses with a balance climbed nearly 7% in the past six months. This metric shows the rising demand for LINK among market participants and the altcoin’s relevance among traders. LINK addresses with balance climbed from 637,030 to 678,790 in a six-month timeframe, as seen on IntoTheBlock.
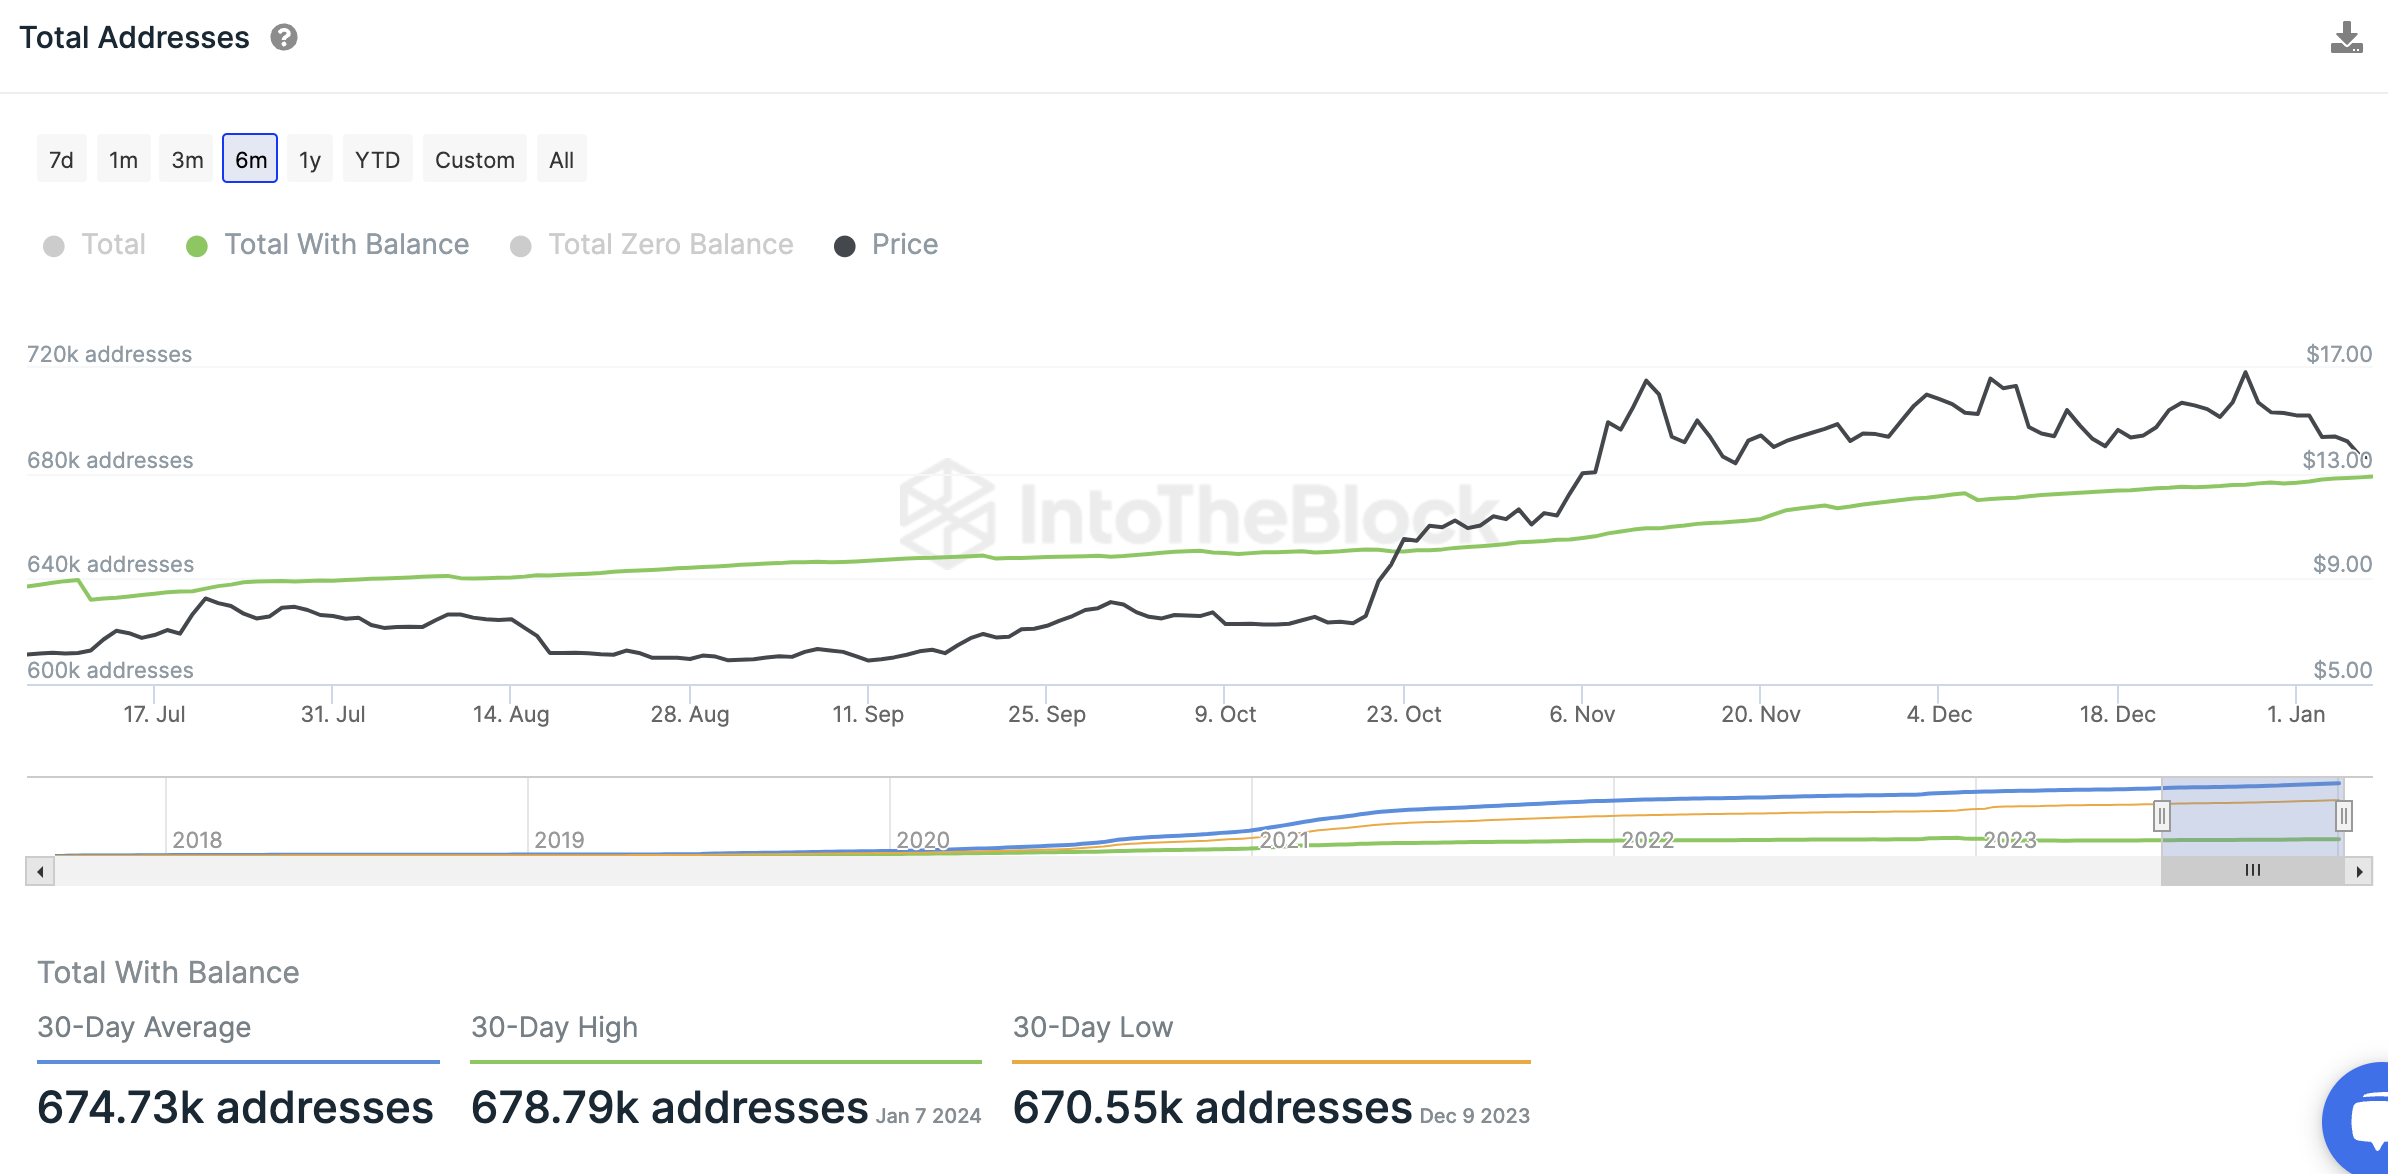
Total Chainlink addresses with balance. Source: IntoTheBlock
Chainlink price gears up for recovery
Chainlink price is currently in an uptrend that started on September 11. The asset’s price is above its 200-day Exponential Moving Average (EMA) at $10.980. The two 10-day and 50-day EMAs at $14.174 and $14.370, respectively, are expected to act as immediate resistance for LINK price in its uptrend.
LINK has sustained above a key level, the 38.2% Fibonacci retracement level of $13.107, which is calculated taking into account the rally from September’s low of $5.759 to the December high of $17.648, as seen in the chart below.
To the upside, Chainlink’s target is likely the 23.6% Fibonacci retracement level at $14.843, close to the psychologically important level of $15.
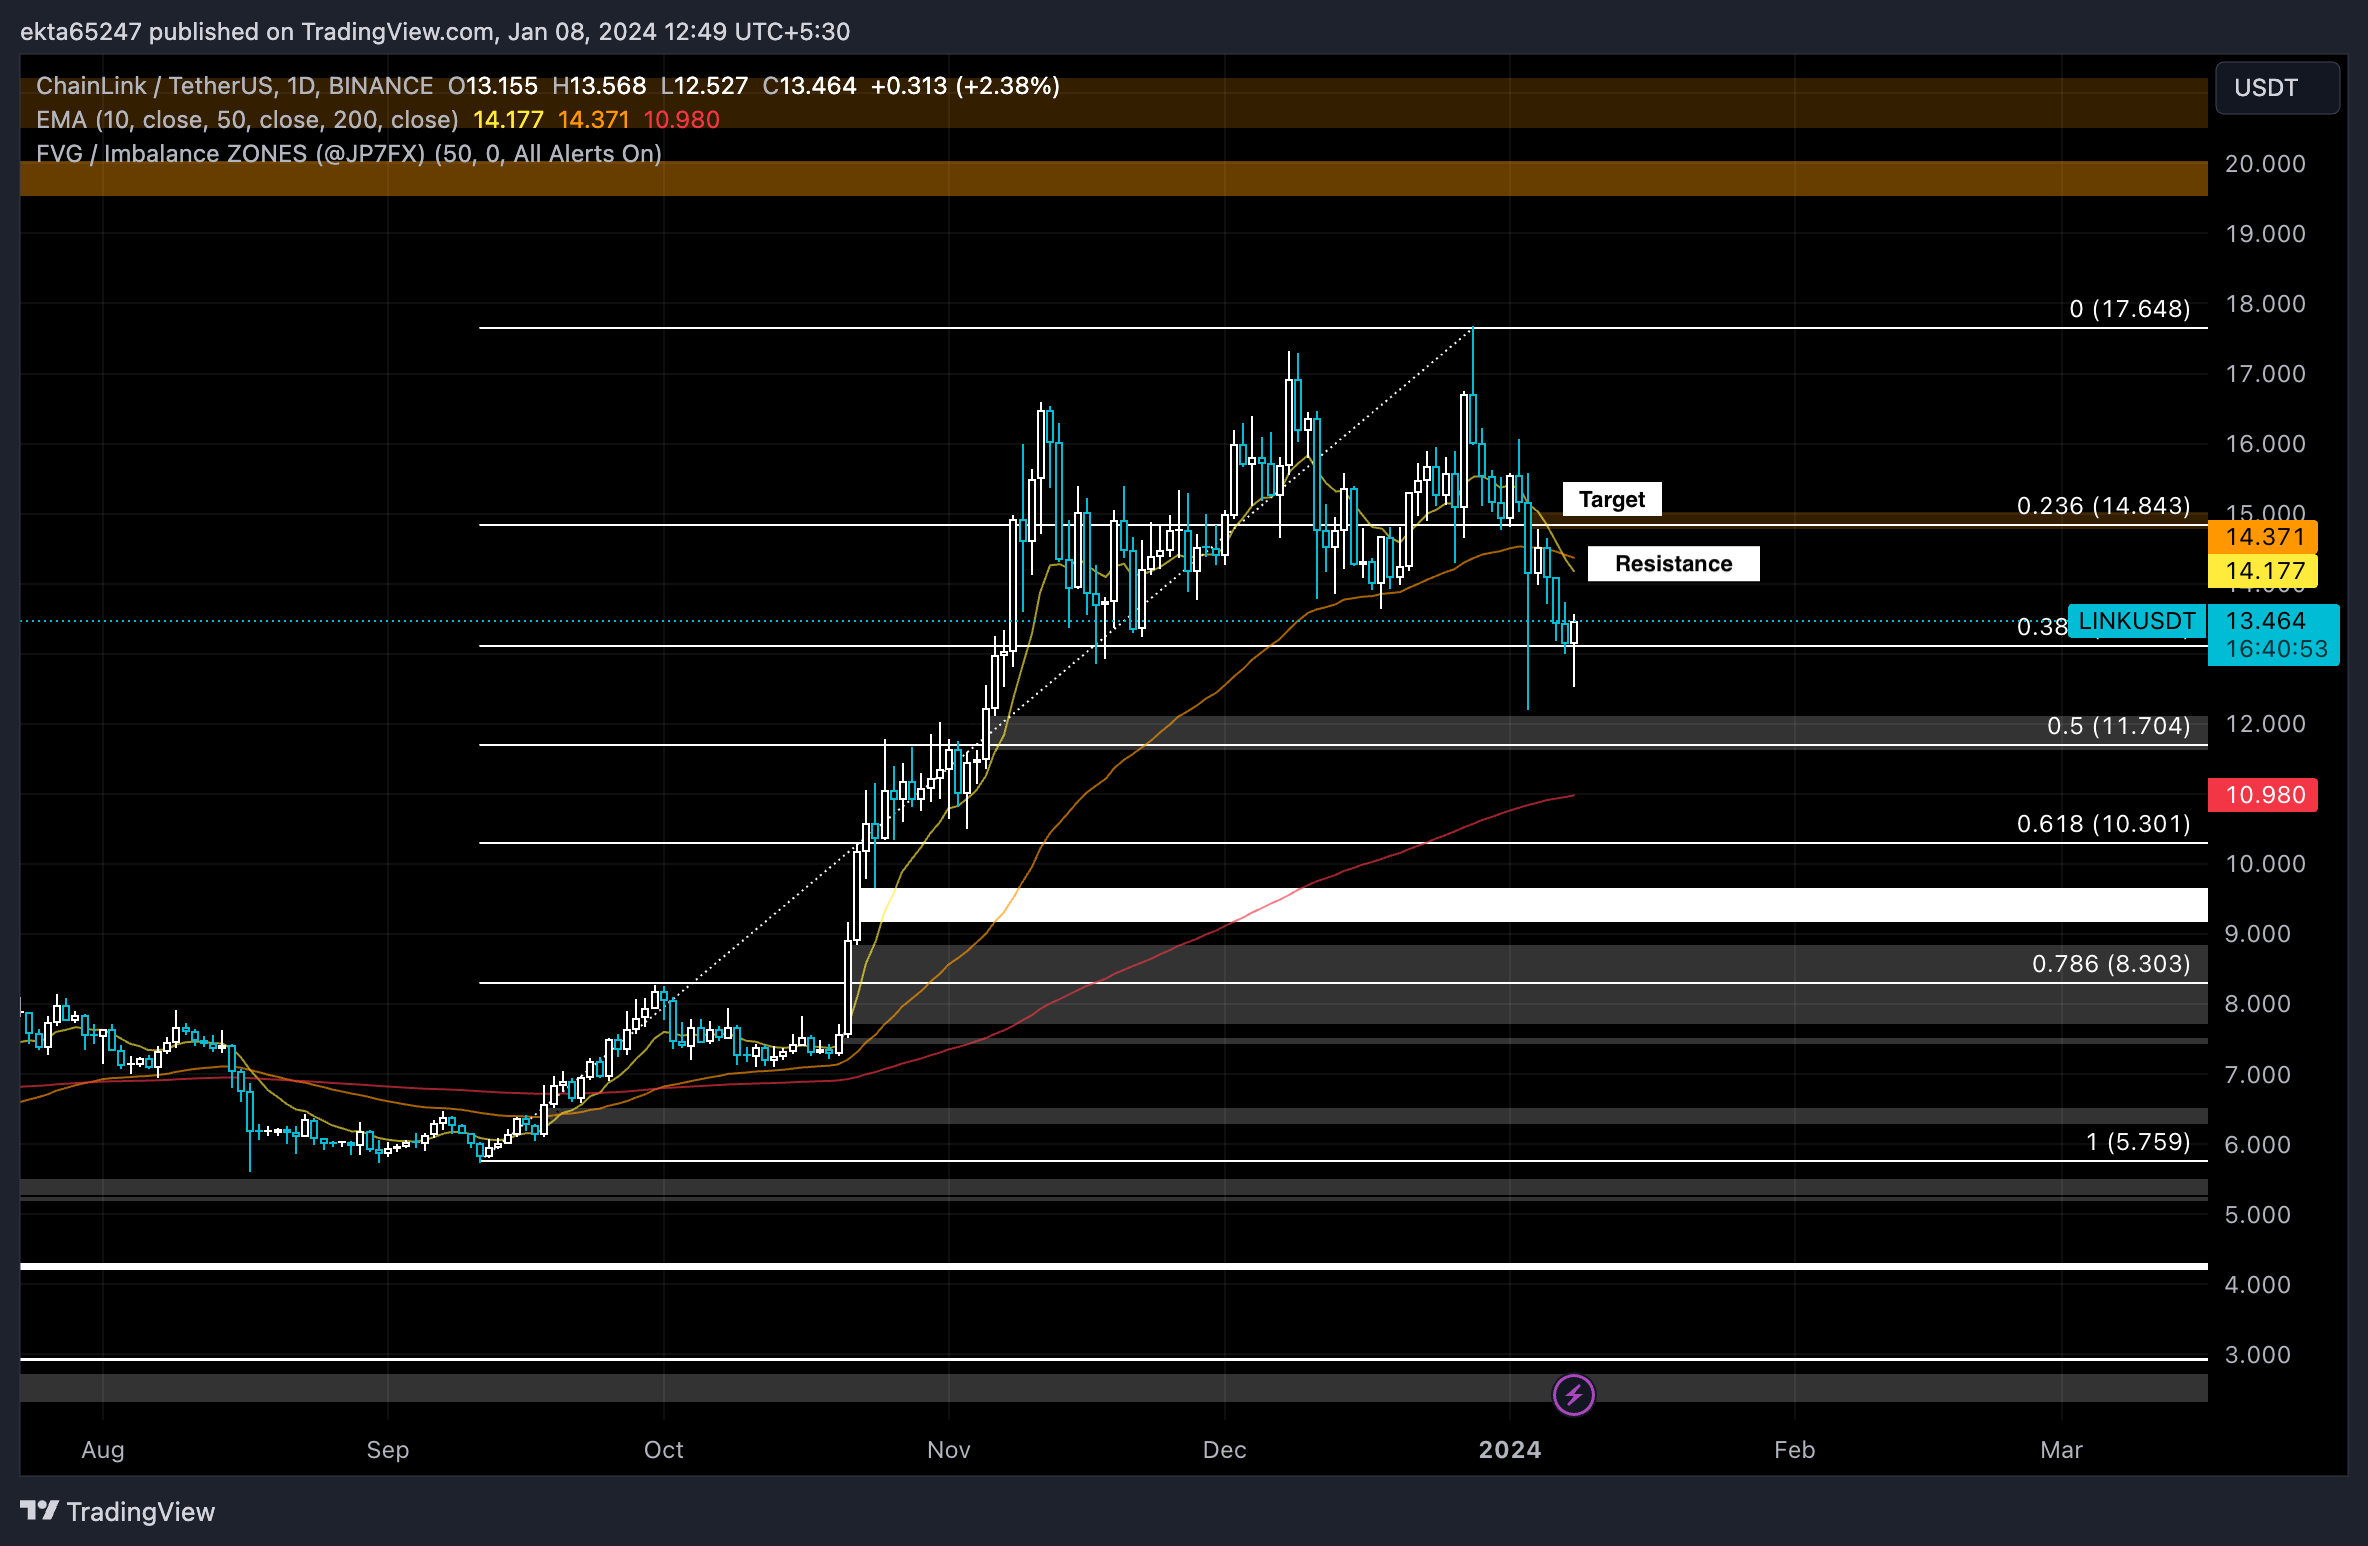
LINK/USDT 1-day chart
In a bearish scenario, a daily candlestick close below the aforementioned 38.2% Fibonacci retracement level at $13.107 could invalidate the thesis for a recovery in LINK price.
Author

Ekta Mourya
FXStreet
Ekta Mourya has extensive experience in fundamental and on-chain analysis, particularly focused on impact of macroeconomics and central bank policies on cryptocurrencies.




