Chainlink price teases with a 20% upside potential as LINK coils up for its next move
- Chainlink price is in the accumulation phase, consolidating while coiling up for a possible transition to the markup phase.
- LINK could rally 20% to tag the $17.163 resistance level before distributing or a quick markdown if market fundamentals fail to produce higher highs.
- The bullish thesis will be invalidated if the altcoin breaks and closes below the $13.330 support level.
Chainlink (LINK) price has been consolidating between the $13.330 and the $17.163 market range since November 8. The ensuing price action has been typical of a market full swing market cycle, presenting clear opportunities for perpetual traders to ride the series of trends, with the next one likely to be a recovery with FXStreet’s reporter Ekta Mourya detailing the on-chain drivers recently.
Also Read: Chainlink supply on exchanges hits six-month low, fueling LINK price recovery thesis
Chainlink price coils up for next move in LINK market cycle
Chainlink (LINK) price is coiling up for its next move. As is the case for every financial market, the crypto market conforms to different phases with traders levering this principle to enter and exit the market. Renowned technical analyst, Richard Wyckoff, the brains behind the Wyckoff method, outlined these four rules:
- Accumulation phase: Sellers exit, price stabilizes, trader indecision, ranging market without clear directional bias
- Markup phase: Buying pressure and therefore rapid price increase, growing trading volume and market activity
- Distribution phase: Selling pressure and therefore rapid price decrease as market sentiments move from confidence to greed or uncertainty while demand and supply even out.
- Markdown phase: Traders often short the market, selling assets off and taking profits on short trades.
Chainlink price appears to be in the accumulation phase after the distribution and markdown phases played out. With this, the markup phase could be in the works for LINK with multiple technical indicators supporting the thesis.
First, the histogram bars of the Awesome Oscillator (AO) are not only flashing green but also inching towards the positive territory. The Moving Average Convergence Divergence (MACD) indicator is also attempting a bullish crossover, pushing toward the upper side of the signal line (orange band). A closer look at the Relative Strength Index (RSI) also shows an inclination to the north that could see it cross above its signal line (yellow band).
With the 100- and 200-day Simple Moving Averages (SMAs) also northbound at $13.156 and $9.994 levels respectively, the north was the path with the least resistance. Increased buying pressure above current levels could see Chainlink price overcome the resistance presented by the 50-day SMA at $14.956, and springboard above it to the $16.000 psychological level. In a highly bullish case, the gains could extend for LINK price to tag the $17.163 resistance level, standing 20% above current levels.
A break and close above this level could see Chainlink price clear the range high at $17.672, potentially going extending a neck up to record a higher high above it.
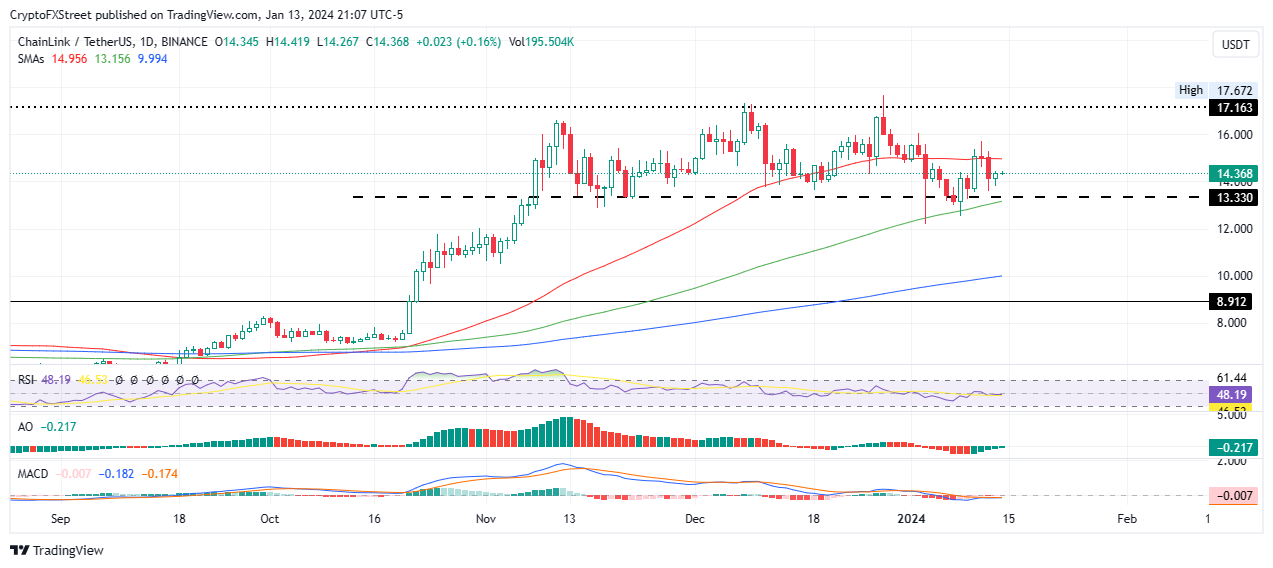
LINK/USDT 1-day chart
On the flipside, if profit taking starts, Chainlink price could drop, losing the critical support at $13.330. A break and close below this level, confirmed by LINK price tagging the 100-day SMA at $13.156, would invalidate the bullish thesis, setting the tone for an extended fall.
In the dire case, Chainlink price could drop further, tagging the $12.000 psychological level, or in the worst case scenario, test the 200-day SMA at $9.994.
Author

Lockridge Okoth
FXStreet
Lockridge is a believer in the transformative power of crypto and the blockchain industry.


