Chainlink Price Prediction: LINK approaches make-or-break point
- Chainlink price fails to overcome the resistance barrier at $35 for the third time in a row.
- A decisive close above $37.40 could seal the bullish fate, but a breakdown of $30 could also trigger a downtrend.
- Transactional data shows little to no resistance ahead for LINK, supporting an optimistic outlook.
-637336005550289133.jpg)
Chainlink price is at a crossroads as buying pressure slows down near a crucial supply barrier.
Chainlink price remains indecisive
Chainlink price has seen three major upswings fail to cross above the $35 level for the last two months, creating a series of highs. Now, the oracle token faces a similar fate as the recent jab to overthrow this barrier has failed and reveals that a minor pullback is imminent.
When the swing highs and lows formed from January 22 are connected using trend lines, LINK shows the formation of an ascending triangle. This pattern has a bullish bias and forecasts a 50% upswing to $52.88, determined by adding distance between the first swing high and low to the triangle’s base at $35.
Although indecisive at this point, if the Chainlink price manages to breach the upper trend line, an upswing seems likely. However, a continuation of the selling pressure could lead to a downtrend.
A secondary confirmation will arrive If the LINK price surges 6.8% and produces a decisive close above the Momentum Reversal Indicator’s (MRI) breakout line at $37.40. The bullish fate will be sealed if the oracle token conquers the subsequent breakout line at $39.28.
If this were to happen, $46.06 and $48.90 could serve as crucial levels for the bulls to pause before hitting the intended target at $52.88.
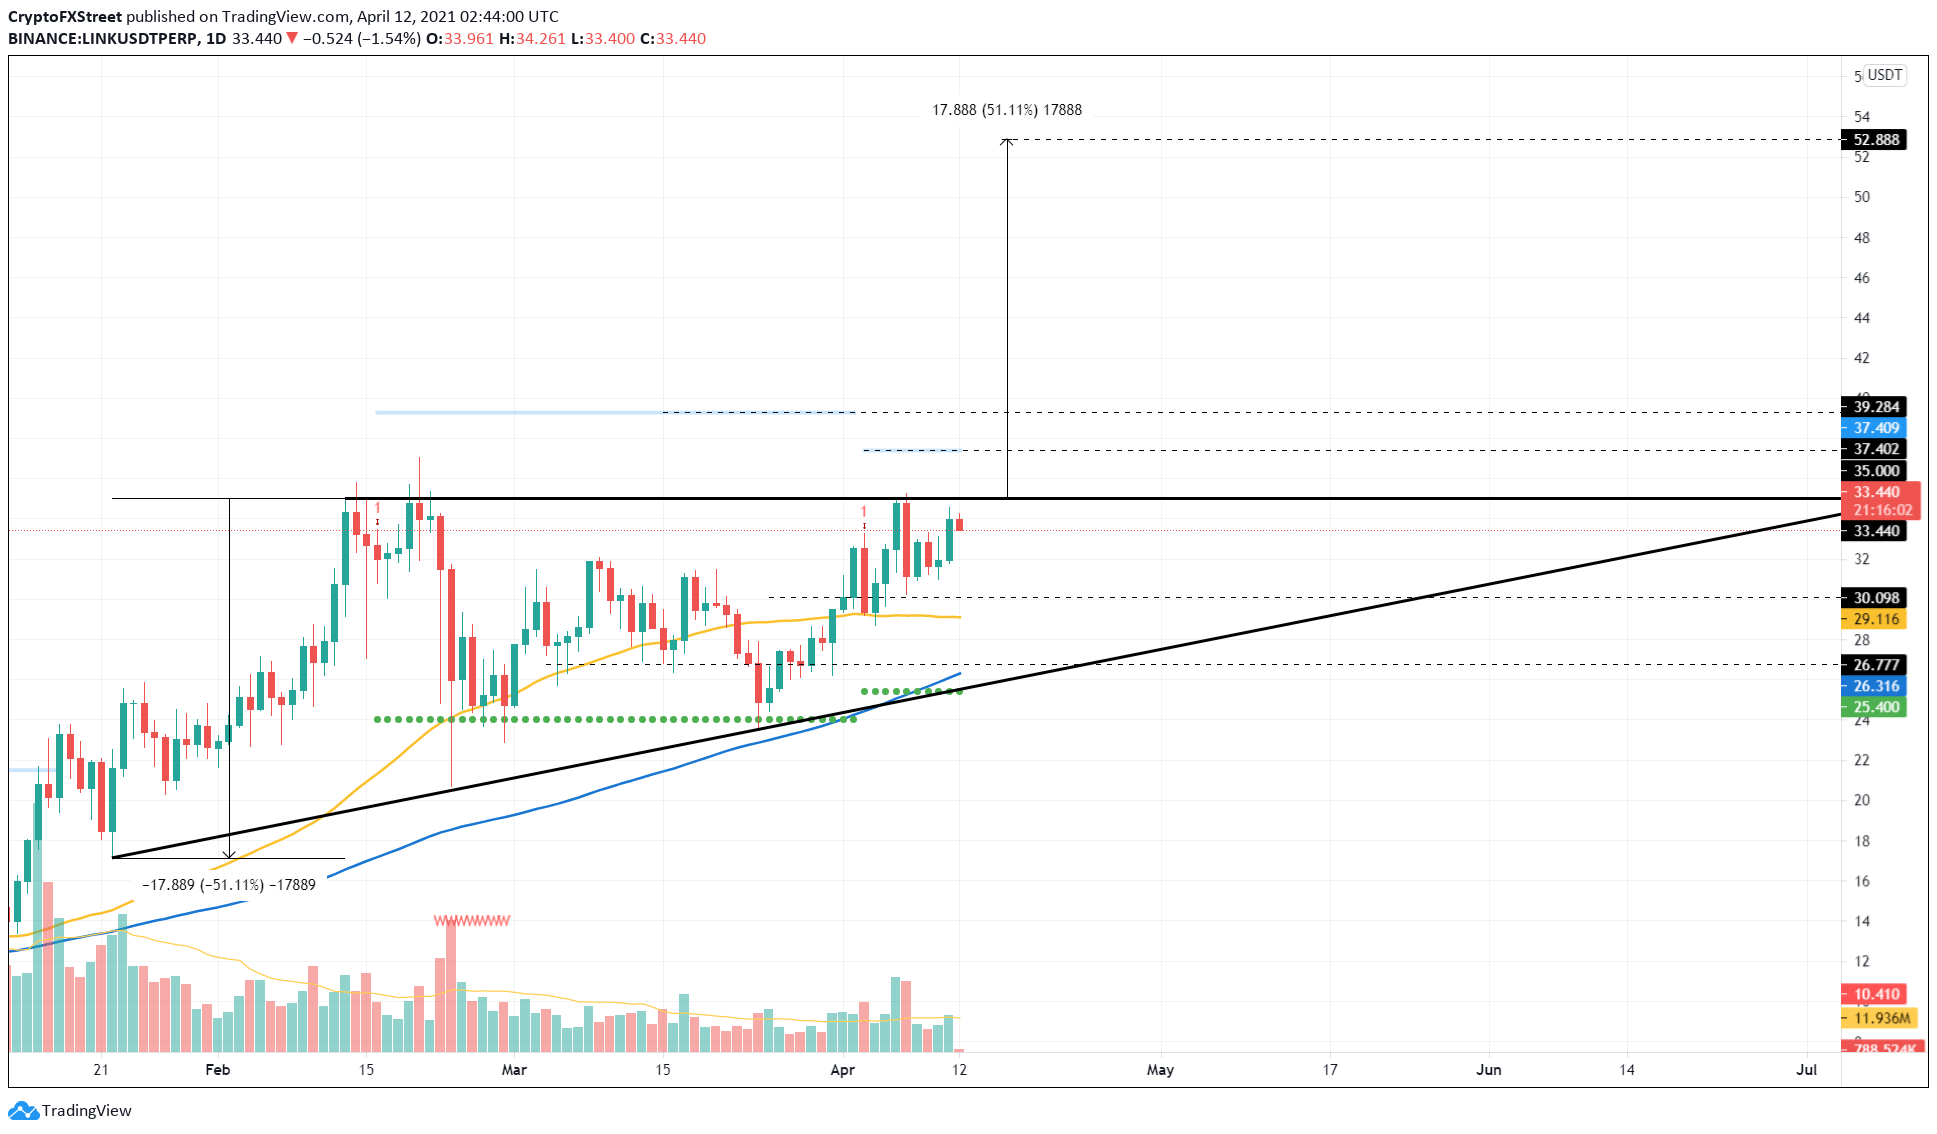
LINK/USDT 1-day chart
Supporting Chainlink’s entry into price discovery mode is IntoTheBlock’s In/Out of the Money Around Price (IOMAP) model, which shows little to no resistance ahead.
In fact, short-term buying pressure could be enough to topple the supply barriers. Therefore, a potential spike in buying pressure could trigger an upswing.
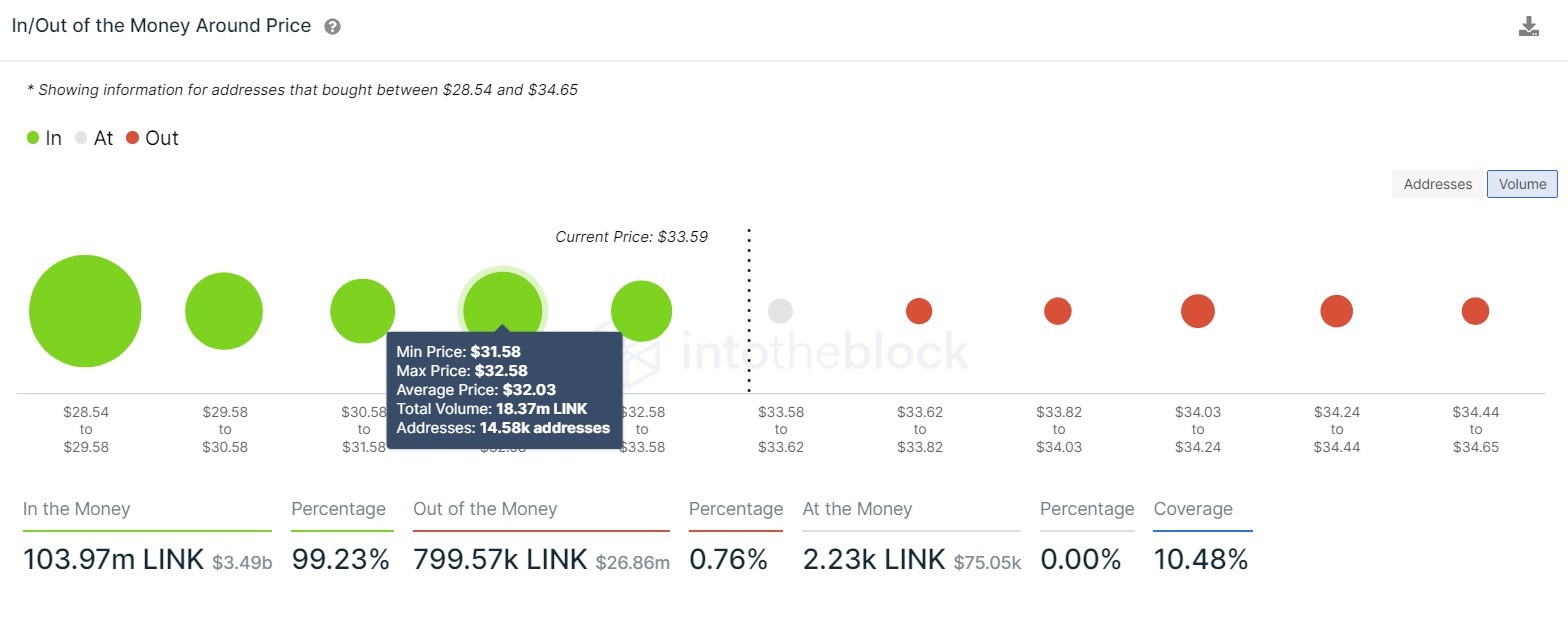
Chainlink IOMAP chart
The Chainlink token supply held on exchanges has seen a stark reduction, suggesting that investors are not inclined to sell at the current price levels. This metric saw an 11.5% decrease from 16% to 14.2% since February 22, meaning investors are optimistic about the bullish potential Chainlink price.
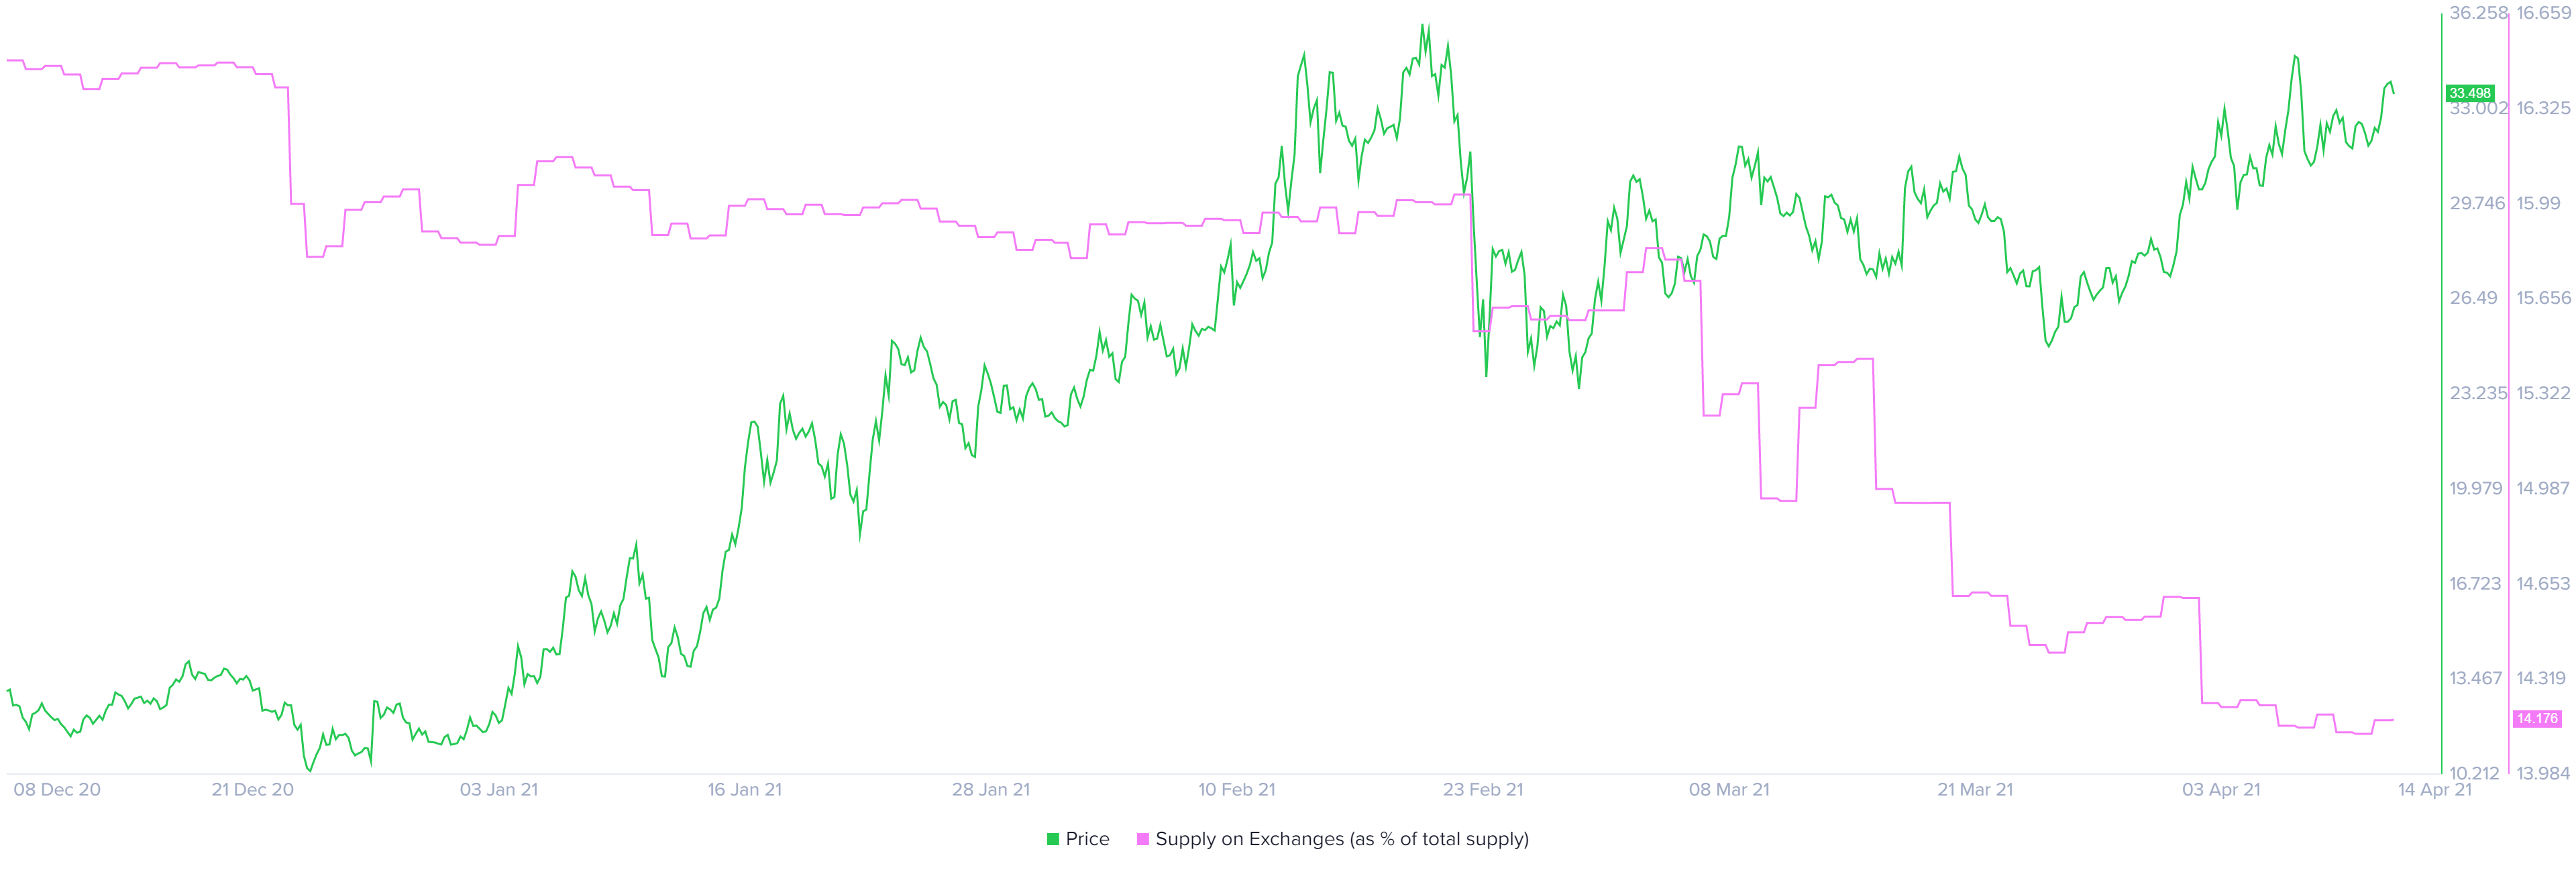
Chainlink supply on exchanges as % of total supply chart
Despite having meager resistance, if the bulls never band together, an upswing will not occur. A breakdown of the immediate support barrier at $32.03 will signal the presence of bears. If this were to happen, IOMAP cohorts reveal 14,500 addresses that purchased 18.73 million LINK here will be “Out of the Money,” increasing the sell-side pressure.
In such a case, a 6% slide that results in a decisive close below $30 will trigger a much steeper corrective phase for Chainlink price.
The 50-day Simple Moving Average at $29.15 could deter this downswing. However, if this level is shattered, LINK might head toward the ascending triangle pattern’s hypotenuse at $26.77.
Author

Akash Girimath
FXStreet
Akash Girimath is a Mechanical Engineer interested in the chaos of the financial markets. Trying to make sense of this convoluted yet fascinating space, he switched his engineering job to become a crypto reporter and analyst.


