|

Chainlink Price Forecast: LINK has to hold above this key point to avoid 10% dip

  • Chainlink price is contained inside an ascending parallel channel on the 4-hour chart.
  • The digital asset is at risk of a 10% breakdown if bulls cannot hold a key support level.
  • LINK bulls are hopeful as there is weak resistance ahead of the current price.

Chainlink has been trading inside an uptrend for the past two weeks but could be on the verge of a significant 10% correction. Nonetheless, LINK bulls remain in control over the short term.

Chainlink price must defend key support level

On the 4-hour chart, Chainlink has formed an ascending parallel channel that can be drawn connecting the higher highs and higher lows with two parallel trend lines. The lower boundary of the channel is set at $32 at the time of writing.

link price

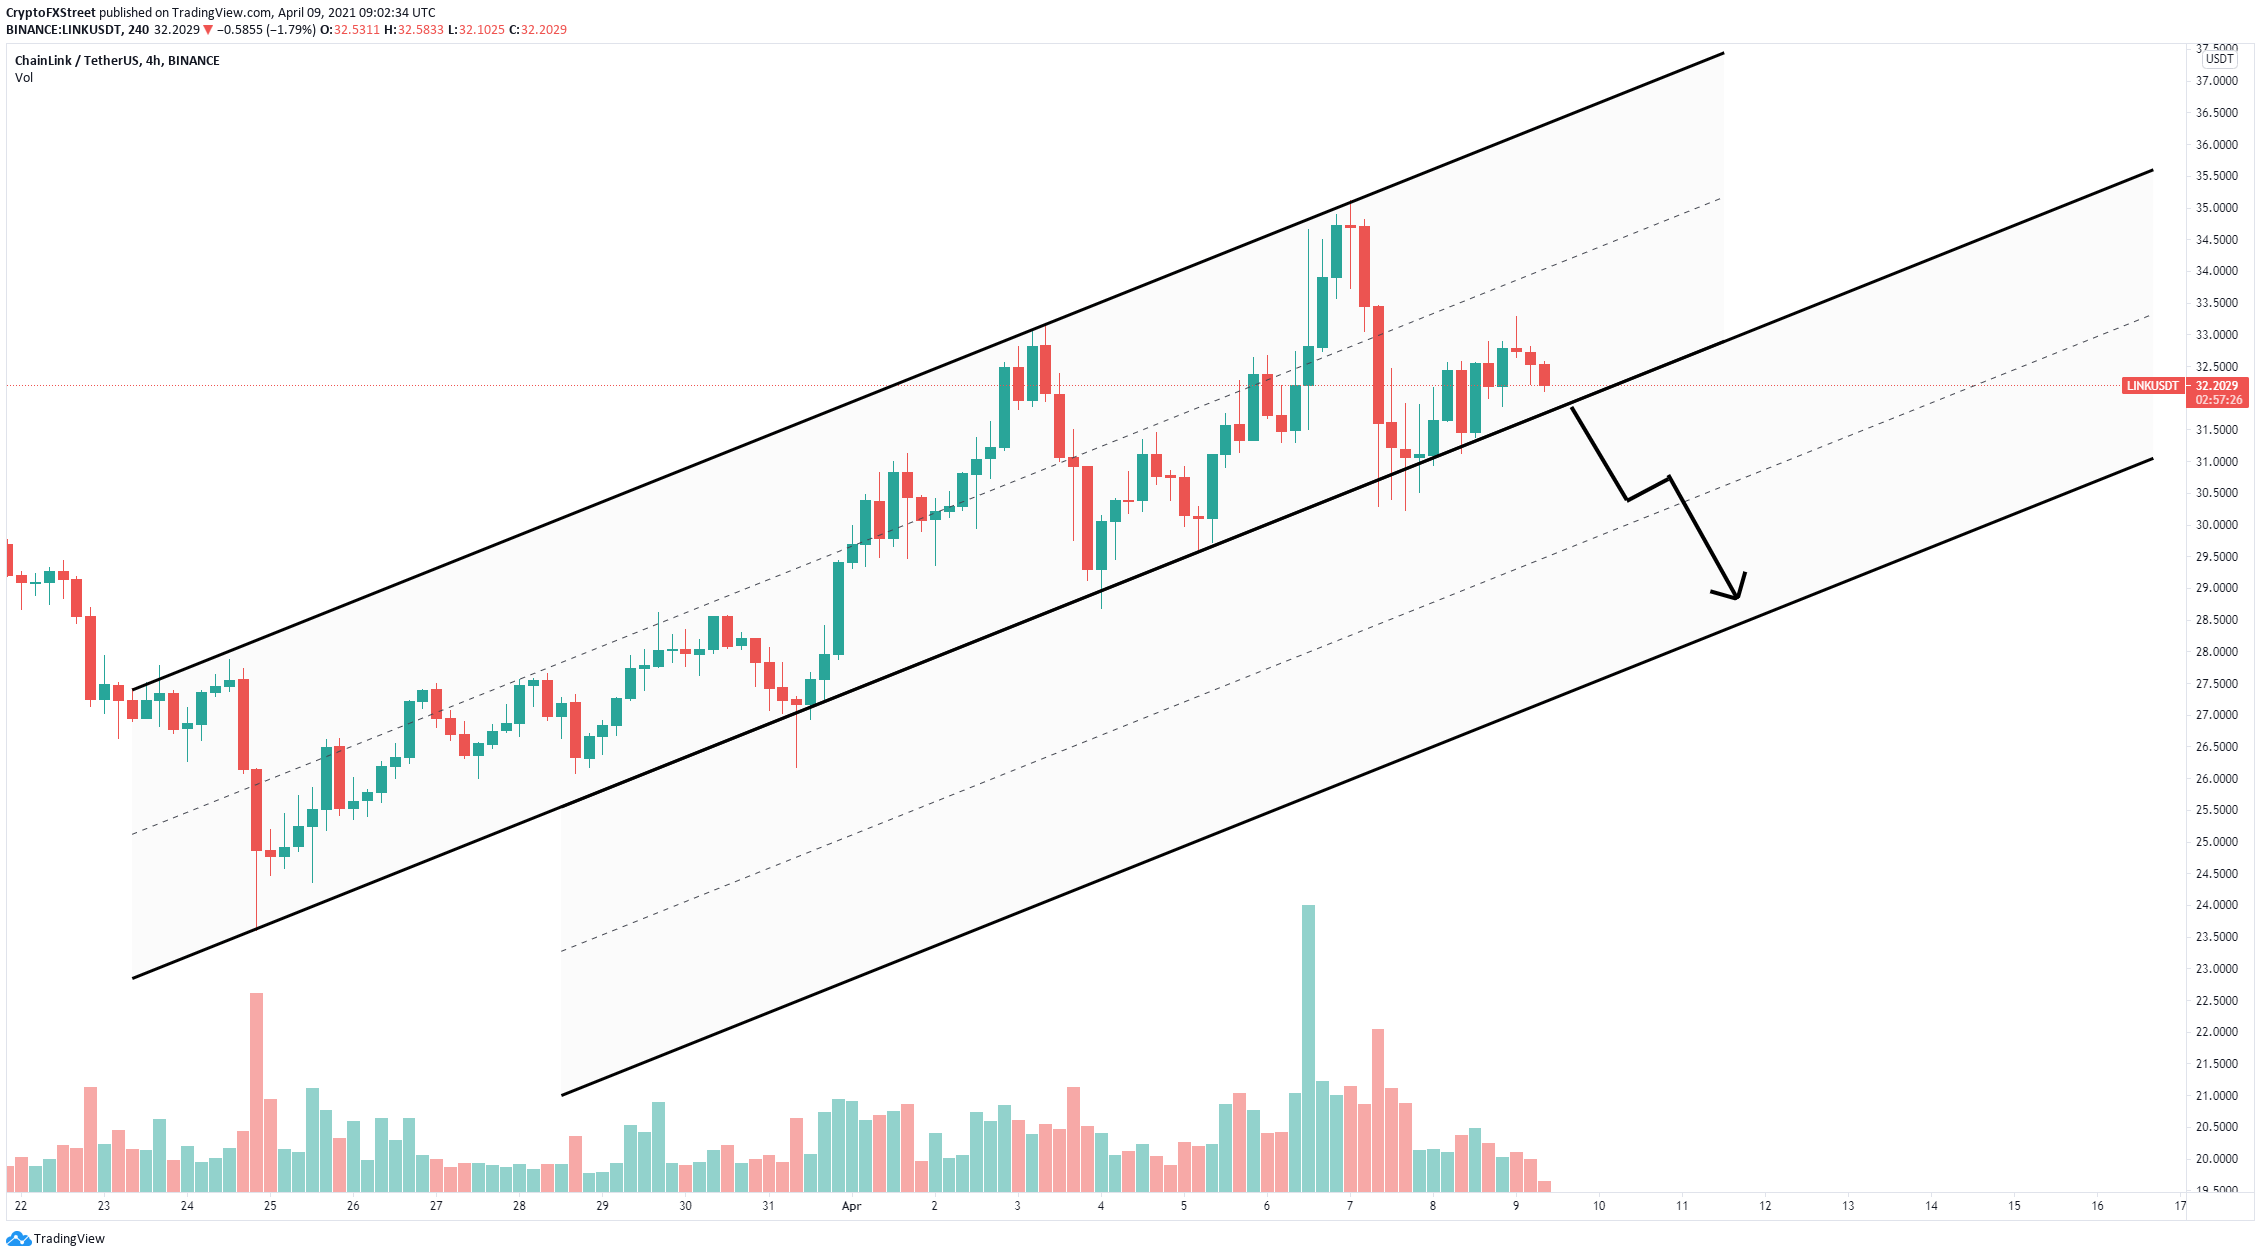
LINK/USD 4-hour chart

A breakdown below $32 will quickly push the Chainlink price down to $30.5 and toward $28.8 eventually. This price target is calculated by measuring the height of the parallel channel. However, bulls remain in control over the short term as long as they can hold this critical support level. 
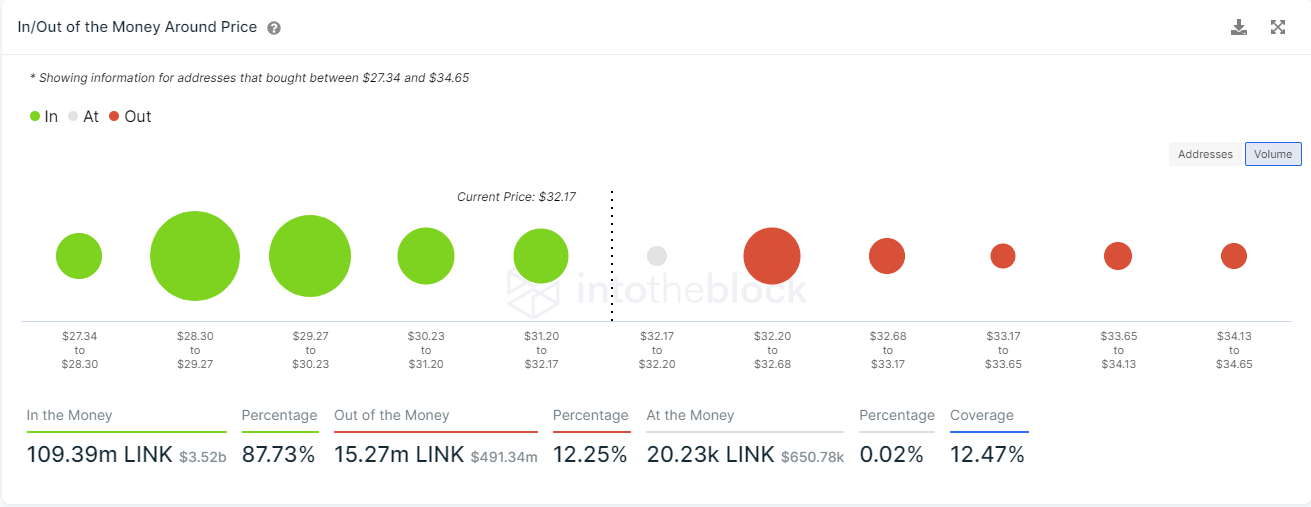
link price

LINK IOMAP chart

The In/Out of the Money Around Price (IOMAP) chart shows only one significant resistance level between $32.20 and $32.68 where 2,890 addresses purchased 12 million LINK. A breakout above this area should quickly drive the Chainlink price toward the middle trend line of the pattern at $34.4 and $36.4 in the longer term. 

The IOMAP model adds credence to the bearish price targets above as it shows a large concentration of buyers between $28.3 and $30.2, which coincide with both targets. This area will absorb a lot of selling pressure, which is why a correction will most likely not go any deeper. 

Author

Lorenzo Stroe

Lorenzo Stroe

Independent Analyst

Lorenzo is an experienced Technical Analyst and Content Writer who has been working in the cryptocurrency industry since 2012. He also has a passion for trading.

More from Lorenzo Stroe
Share:

Editor's Picks

Bitcoin slips below $75,000 as selling pressure accelerates

Bitcoin (BTC) price falls below the $75,000 mark on Monday, having corrected nearly 11% in the previous week and reaching level not seen in nearly 10 months. Market momentum has clearly turned bearish, with technical indicators pointing to further downside toward the next key support at $70,000.

Top 3 Price Prediction: Bitcoin, Ethereum, and Ripple weakness persists after massive correction

Bitcoin, Ethereum and Ripple trade in red on Monday after dipping by over 11%, 19% and 13%, respectively, in the previous week. The top three cryptocurrencies have shed 10%, 17%, and 10.5% in the first month of 2026, highlighting persistent downside pressure.

Top Crypto Losers: Monero, Ethereum, and Kaspa face intense sell-off

Altcoins, including Monero, Ethereum, and Kaspa, are leading the broader cryptocurrency market decline with a steep correction on Sunday. Monero and Ethereum are close to critical support levels near $400 and $2,300, respectively.

Solana Price Forecast: SOL slips below $100, risks deeper correction

Solana (SOL) price extends its correction, trading below $100 on Monday after losing more than 15% in the previous week. The bearish price action is further backed by derivatives data, which shows rising short bets and negative funding rates.

Bitcoin Price Annual Forecast: BTC holds long-term bullish structure heading into 2026

Bitcoin (BTC) is wrapping up 2025 as one of its most eventful years, defined by unprecedented institutional participation, major regulatory developments, and extreme price volatility.

Bitcoin: BTC correction deepens as Fed stance, US-Iran risks, mining disruptions weigh

Bitcoin (BTC) price extends correction, trading below $82,000 after sliding more than 5% so far this week. The bearish price action in BTC was fueled by fading institutional demand, as evidenced by spot Exchange-Traded Funds (ETFs), which recorded $978 million in inflows through Thursday.