Chainlink price on the brink of a massive crash, according to technicals
- Chainlink price has formed an ascending broadening wedge pattern on the 12-hour chart.
- The digital asset faces robust resistance above and it’s on the verge of a breakdown.
- LINK bulls must defend a critical support level to avoid a huge crash.
-637336005550289133.jpg)
Chainlink price has been trading in a weak 12-hour uptrend but is once again on the brink of a significant breakdown below a key support level.
Chainlink price at major risk of a crash
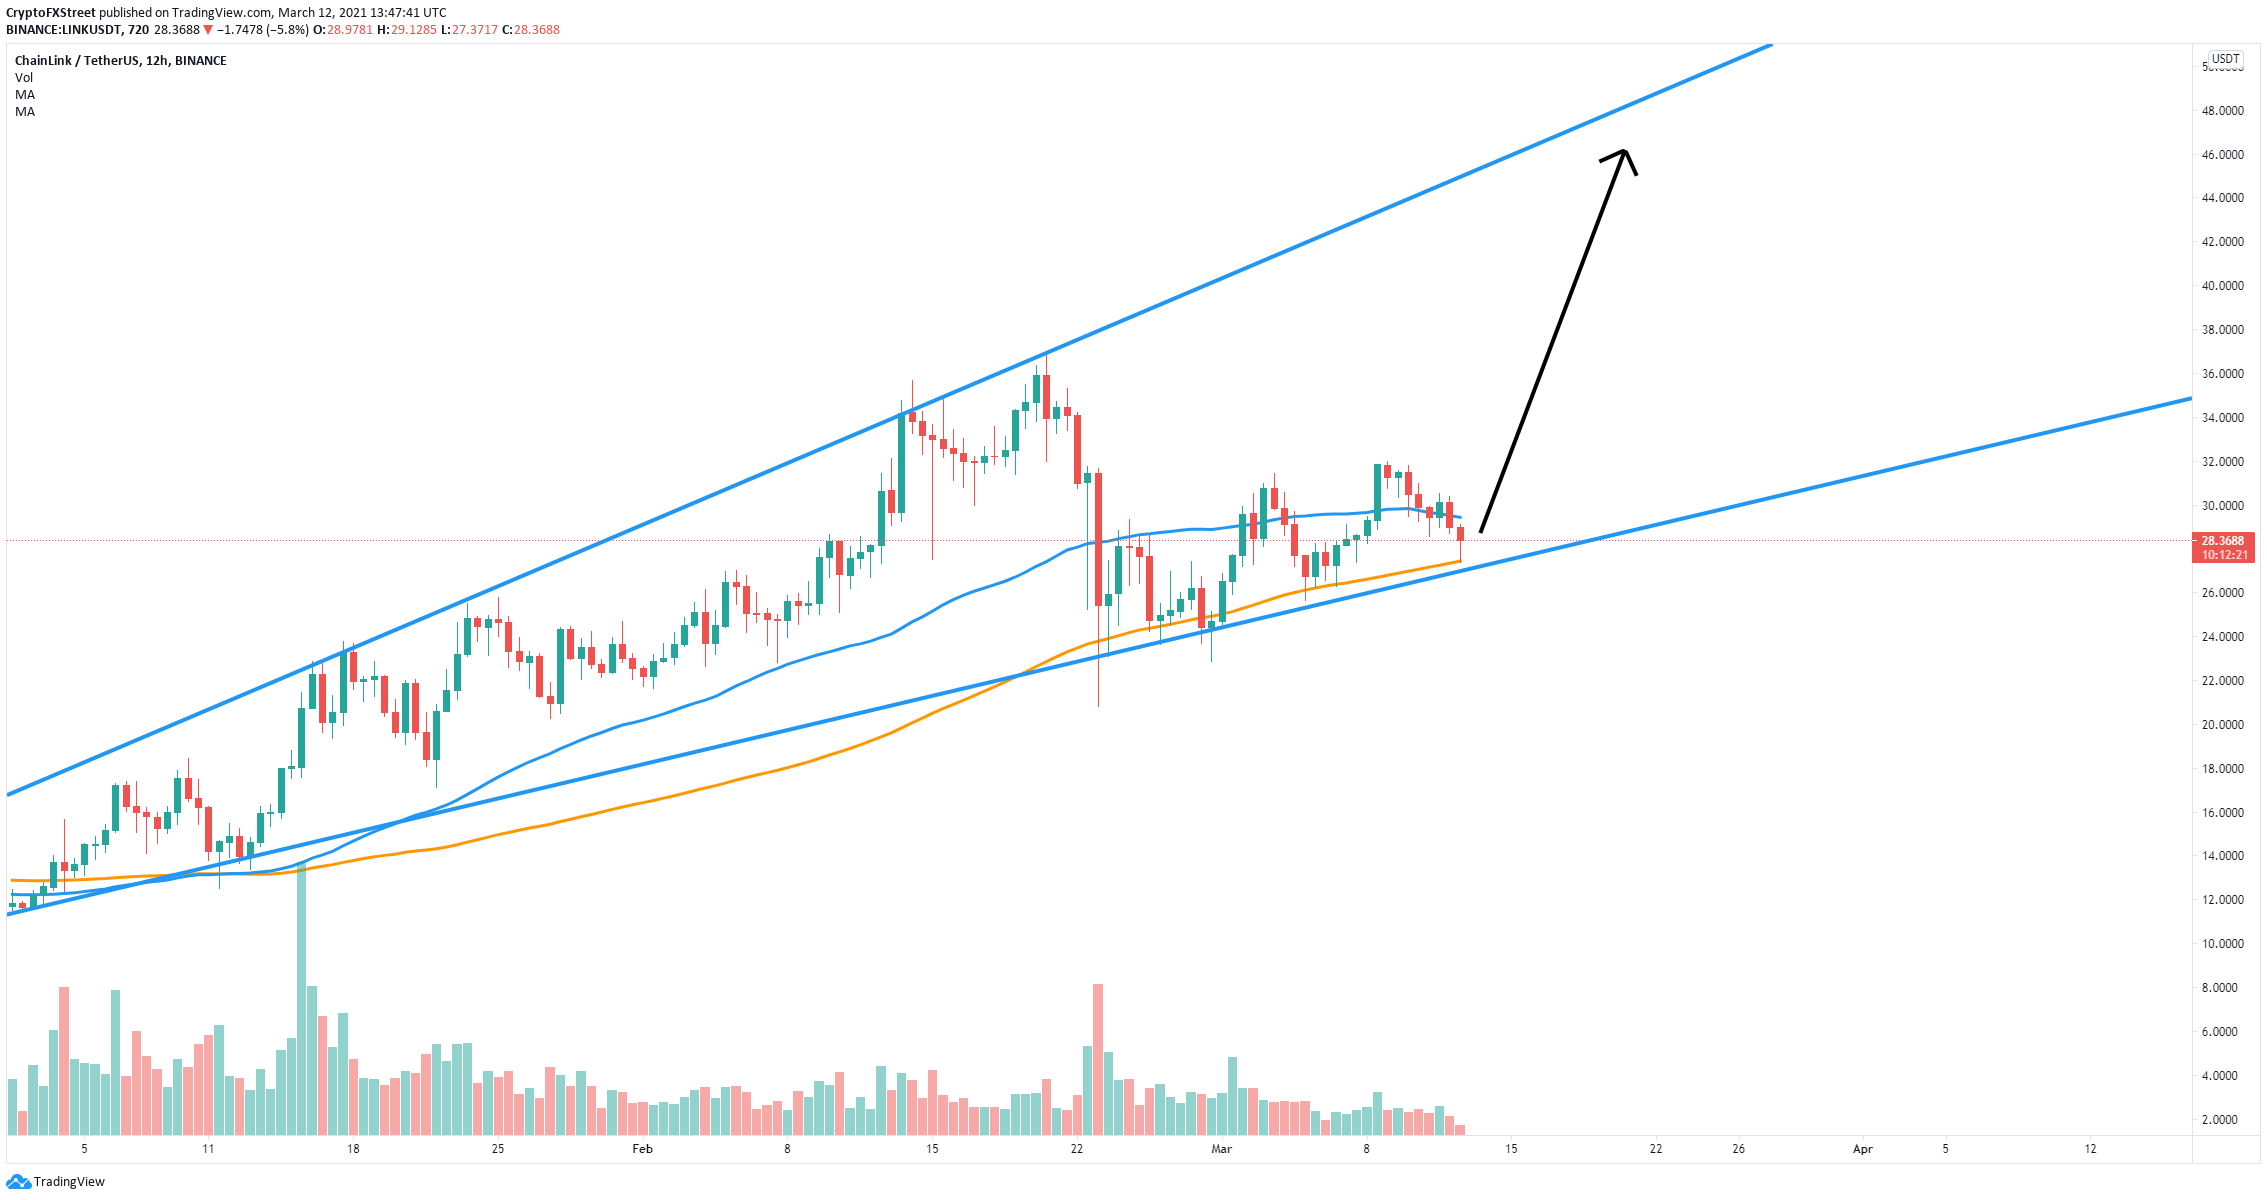
On the 12-hour chart, Chainlink has been trading inside an ascending broadening wedge pattern since December 24, 2020. Once again, the digital asset is on the verge of a breakdown below the key support trendline at $27.

LINK/USD 12-hour chart
Losing this key level will drive Chainlink price down by 40% towards a low of $16. This theory is reinforced by the In/Out of the Money Around Price (IOMAP) chart, which shows steep resistance above $28, but extremely weak support below in comparison.

LINK IOMAP chart
The most significant support area is located between $27 and $28, with 8.27 million LINK in volume. Again, a breakdown below this point will quickly drive Chainlink price towards a target of $16.
LINK/USD 12-hour chart
On the other hand, if LINK bulls can hold the key support level at $27 which coincides with the 50-SMA, the likelihood of a massive rebound towards the upper trendline will increase. The long-term price target for this would be about $48.
Author

Lorenzo Stroe
Independent Analyst
Lorenzo is an experienced Technical Analyst and Content Writer who has been working in the cryptocurrency industry since 2012. He also has a passion for trading.


