Chainlink Price Forecast Q4: Bullish momentum hints at a 25% rally for LINK
- Chainlink price on the weekly time frame looks indecisive as it hovers around the 20-week SMA.
- On the three-day chart, LINK has tagged the range low at $5.70, hinting at a potential bounce.
- The daily chart shows a clear bullish divergence, adding credence to the short-term bullish outlook.
- Investors can expect the Oracle token to trigger a northbound move between 25% to 30%.
-637336005550289133.jpg)
Chainlink price could trigger a rally on the daily and three-day time frame, while the outlook of the higher weekly time frame remains indecisive. Investors should pay attention to on-chain metrics that could show whales starting to buy the dip for the LINK token.
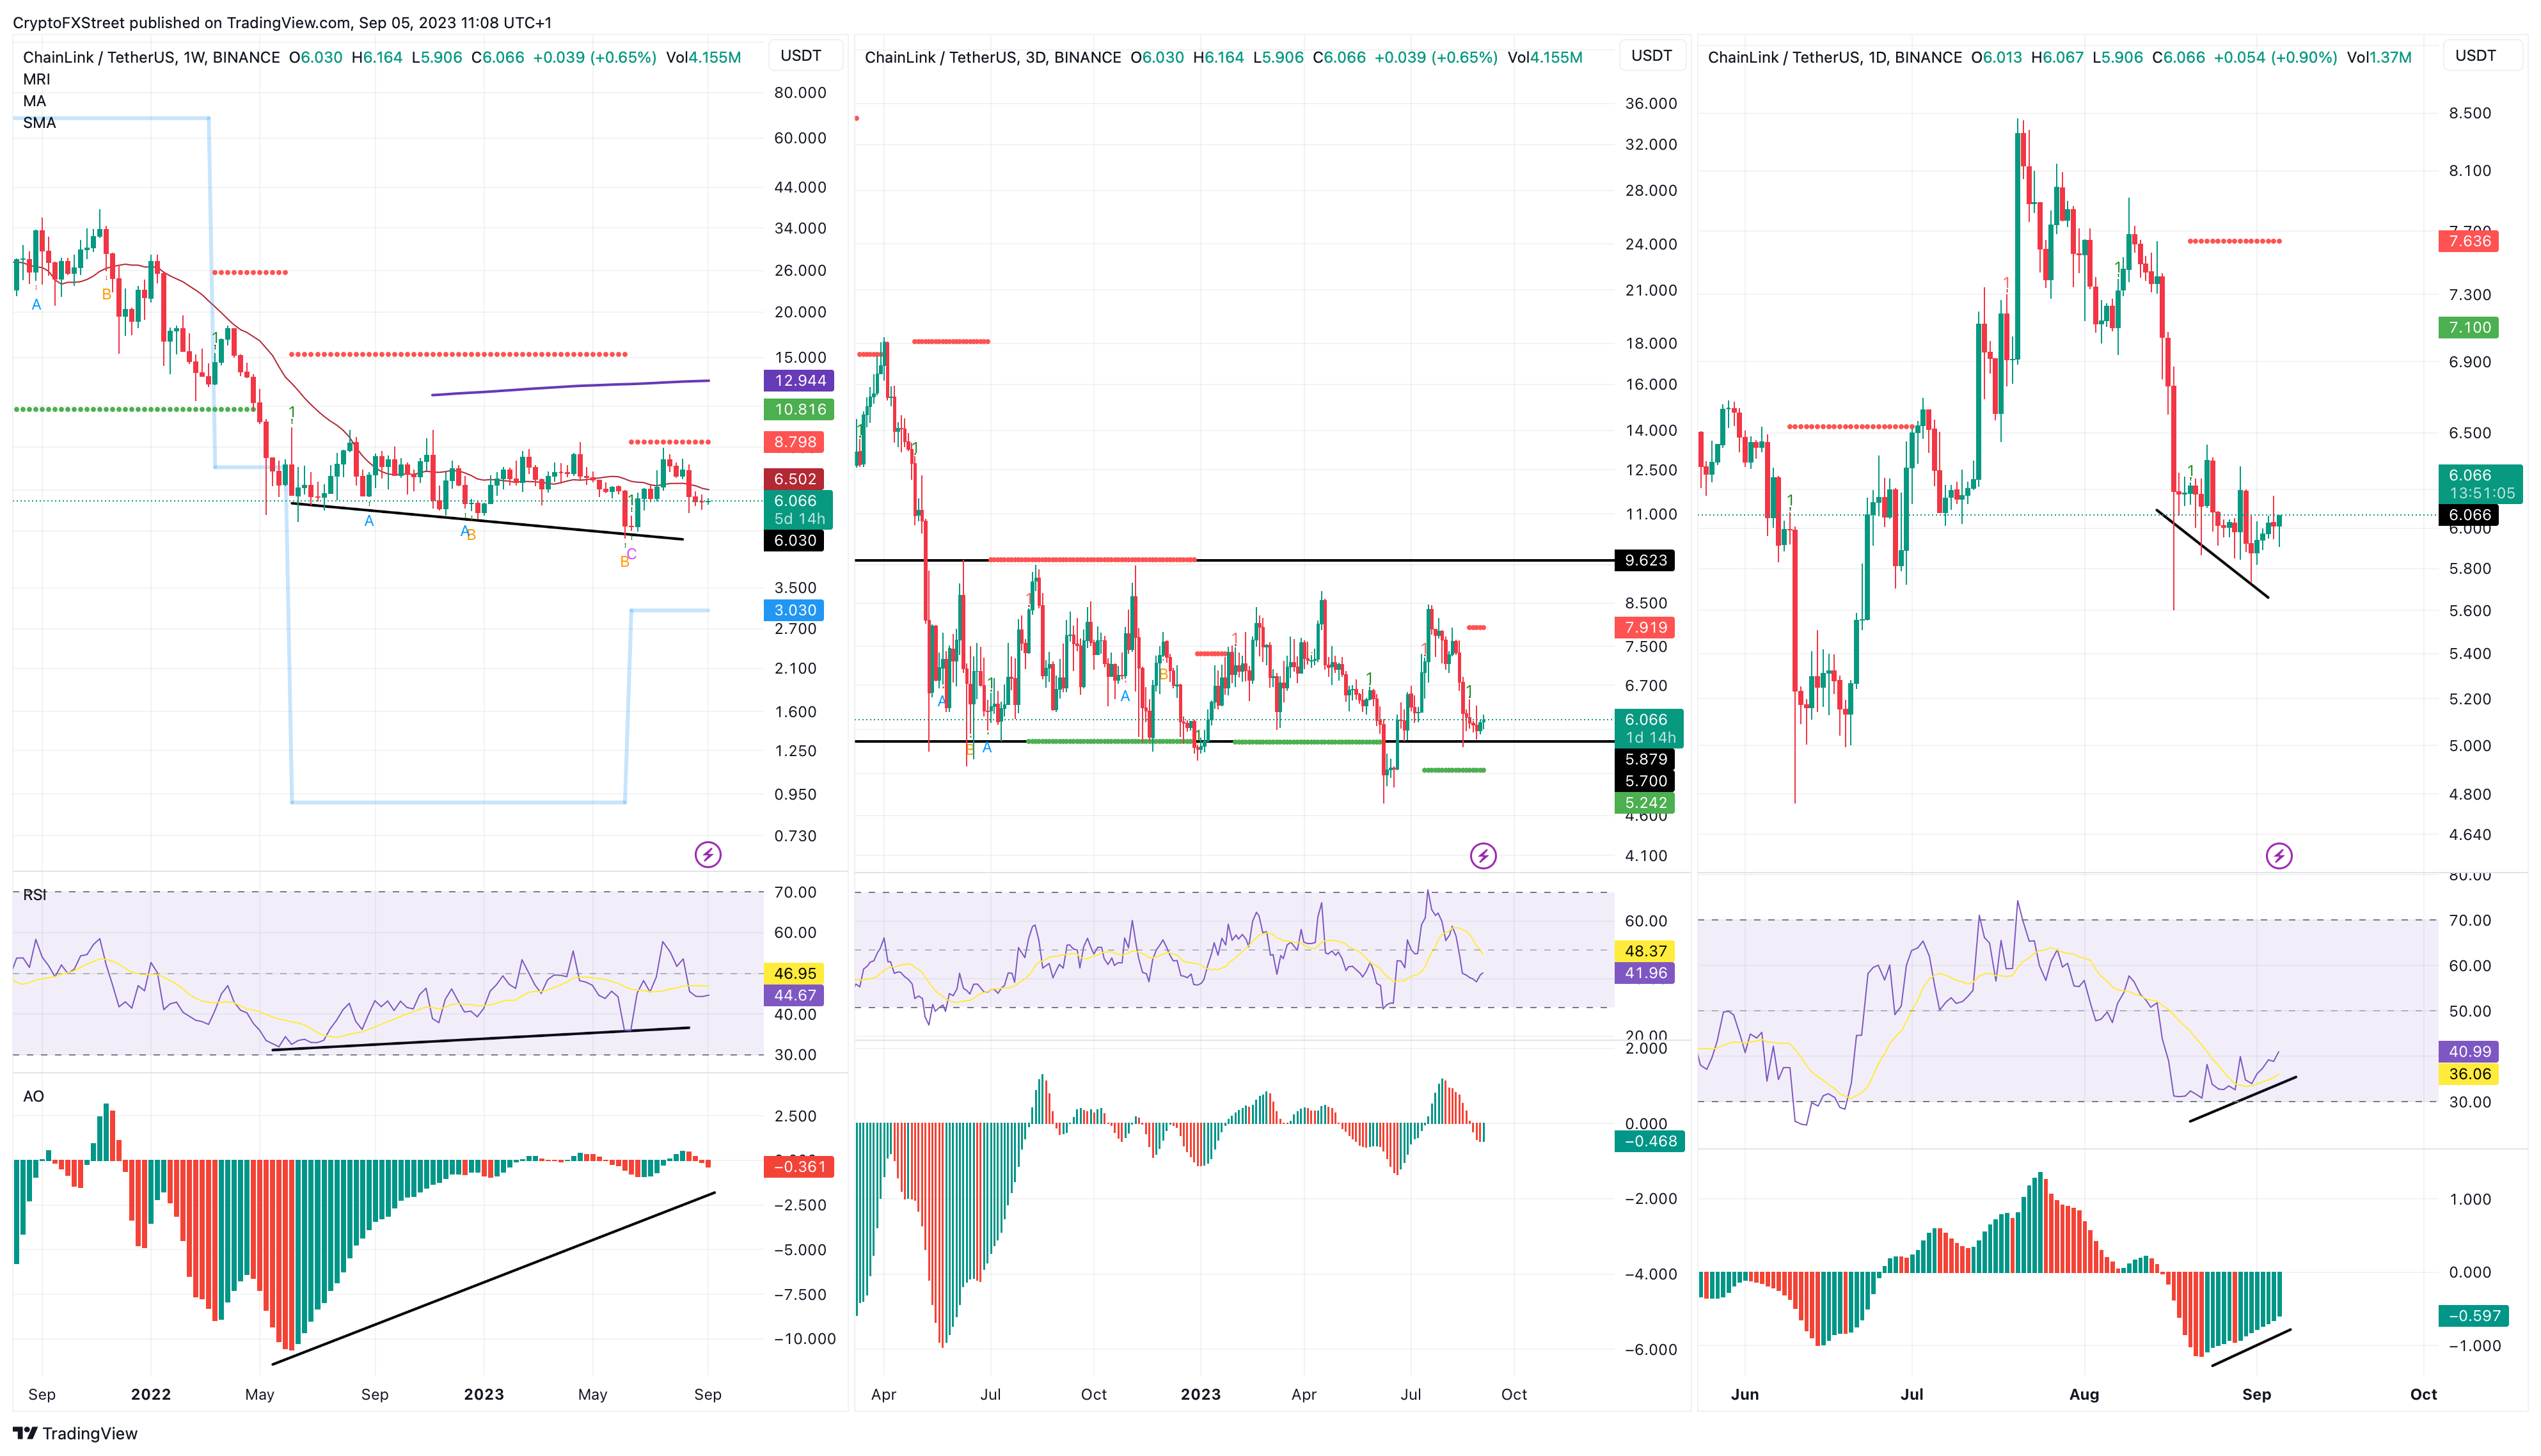
LINK/USDT 1-week, 3-day, 1-day chart
Read more: Correct: Chainlink price set for further falls after 5% drop
Chainlink Weekly Price Forecast: No directional bias
Chainlink price has been hovering around the 20-week Simple Moving Average (SMA) for more than a year. During this consolidation phase, LINK price has set up multiple lower lows while the Relative Strength Index (RSI) and the Awesome Oscillator (AO) have produced higher lows.
This non-conformity is also termed a bullish divergence. The technical formation indicates an increasing buyer momentum that has not yet been reflected in the underlying asset’s price. Hence, a resolution of this pattern often results in a bullish move.
But as long as LINK remains under the 20-week SMA at $6.502, the chances of a prolonged uptrend are slim.

LINK/USDT 1-week chart
Read more: Chainlink Price Prediction: LINK bulls gear up for 60% rally
Chainlink Three-day Price Forecast: LINK holders can expect profits soon
The three-day chart for Chainlink price shows that it has been hovering between the $5.700 and $9.623 barriers. For the past year, every time LINK slipped below the range low, buyers have stepped in, triggering a recovery rally.
At the time of writing, Chainlink price is hovering around $6.066. A bounce from the current position could send LINK up by 30% to tag the $7.919 hurdle signaled by the Momentum Reversal Indicator (MRI).
In a highly bullish case, LINK could extend the gains from 30% to 57% by retesting the range high at $9.623.

LINK/USDT 3-day chart
Chainlink Daily Price Forecast: Conservative outlook
Chainlink price on the daily chart shows a breakout from the bullish divergence that has resulted in a 3.35% run-up between September 1 and 5. The MRI indicator’s resistance barrier at $7.636 is the next critical hurdle, which is roughly 25% away from the current price level.
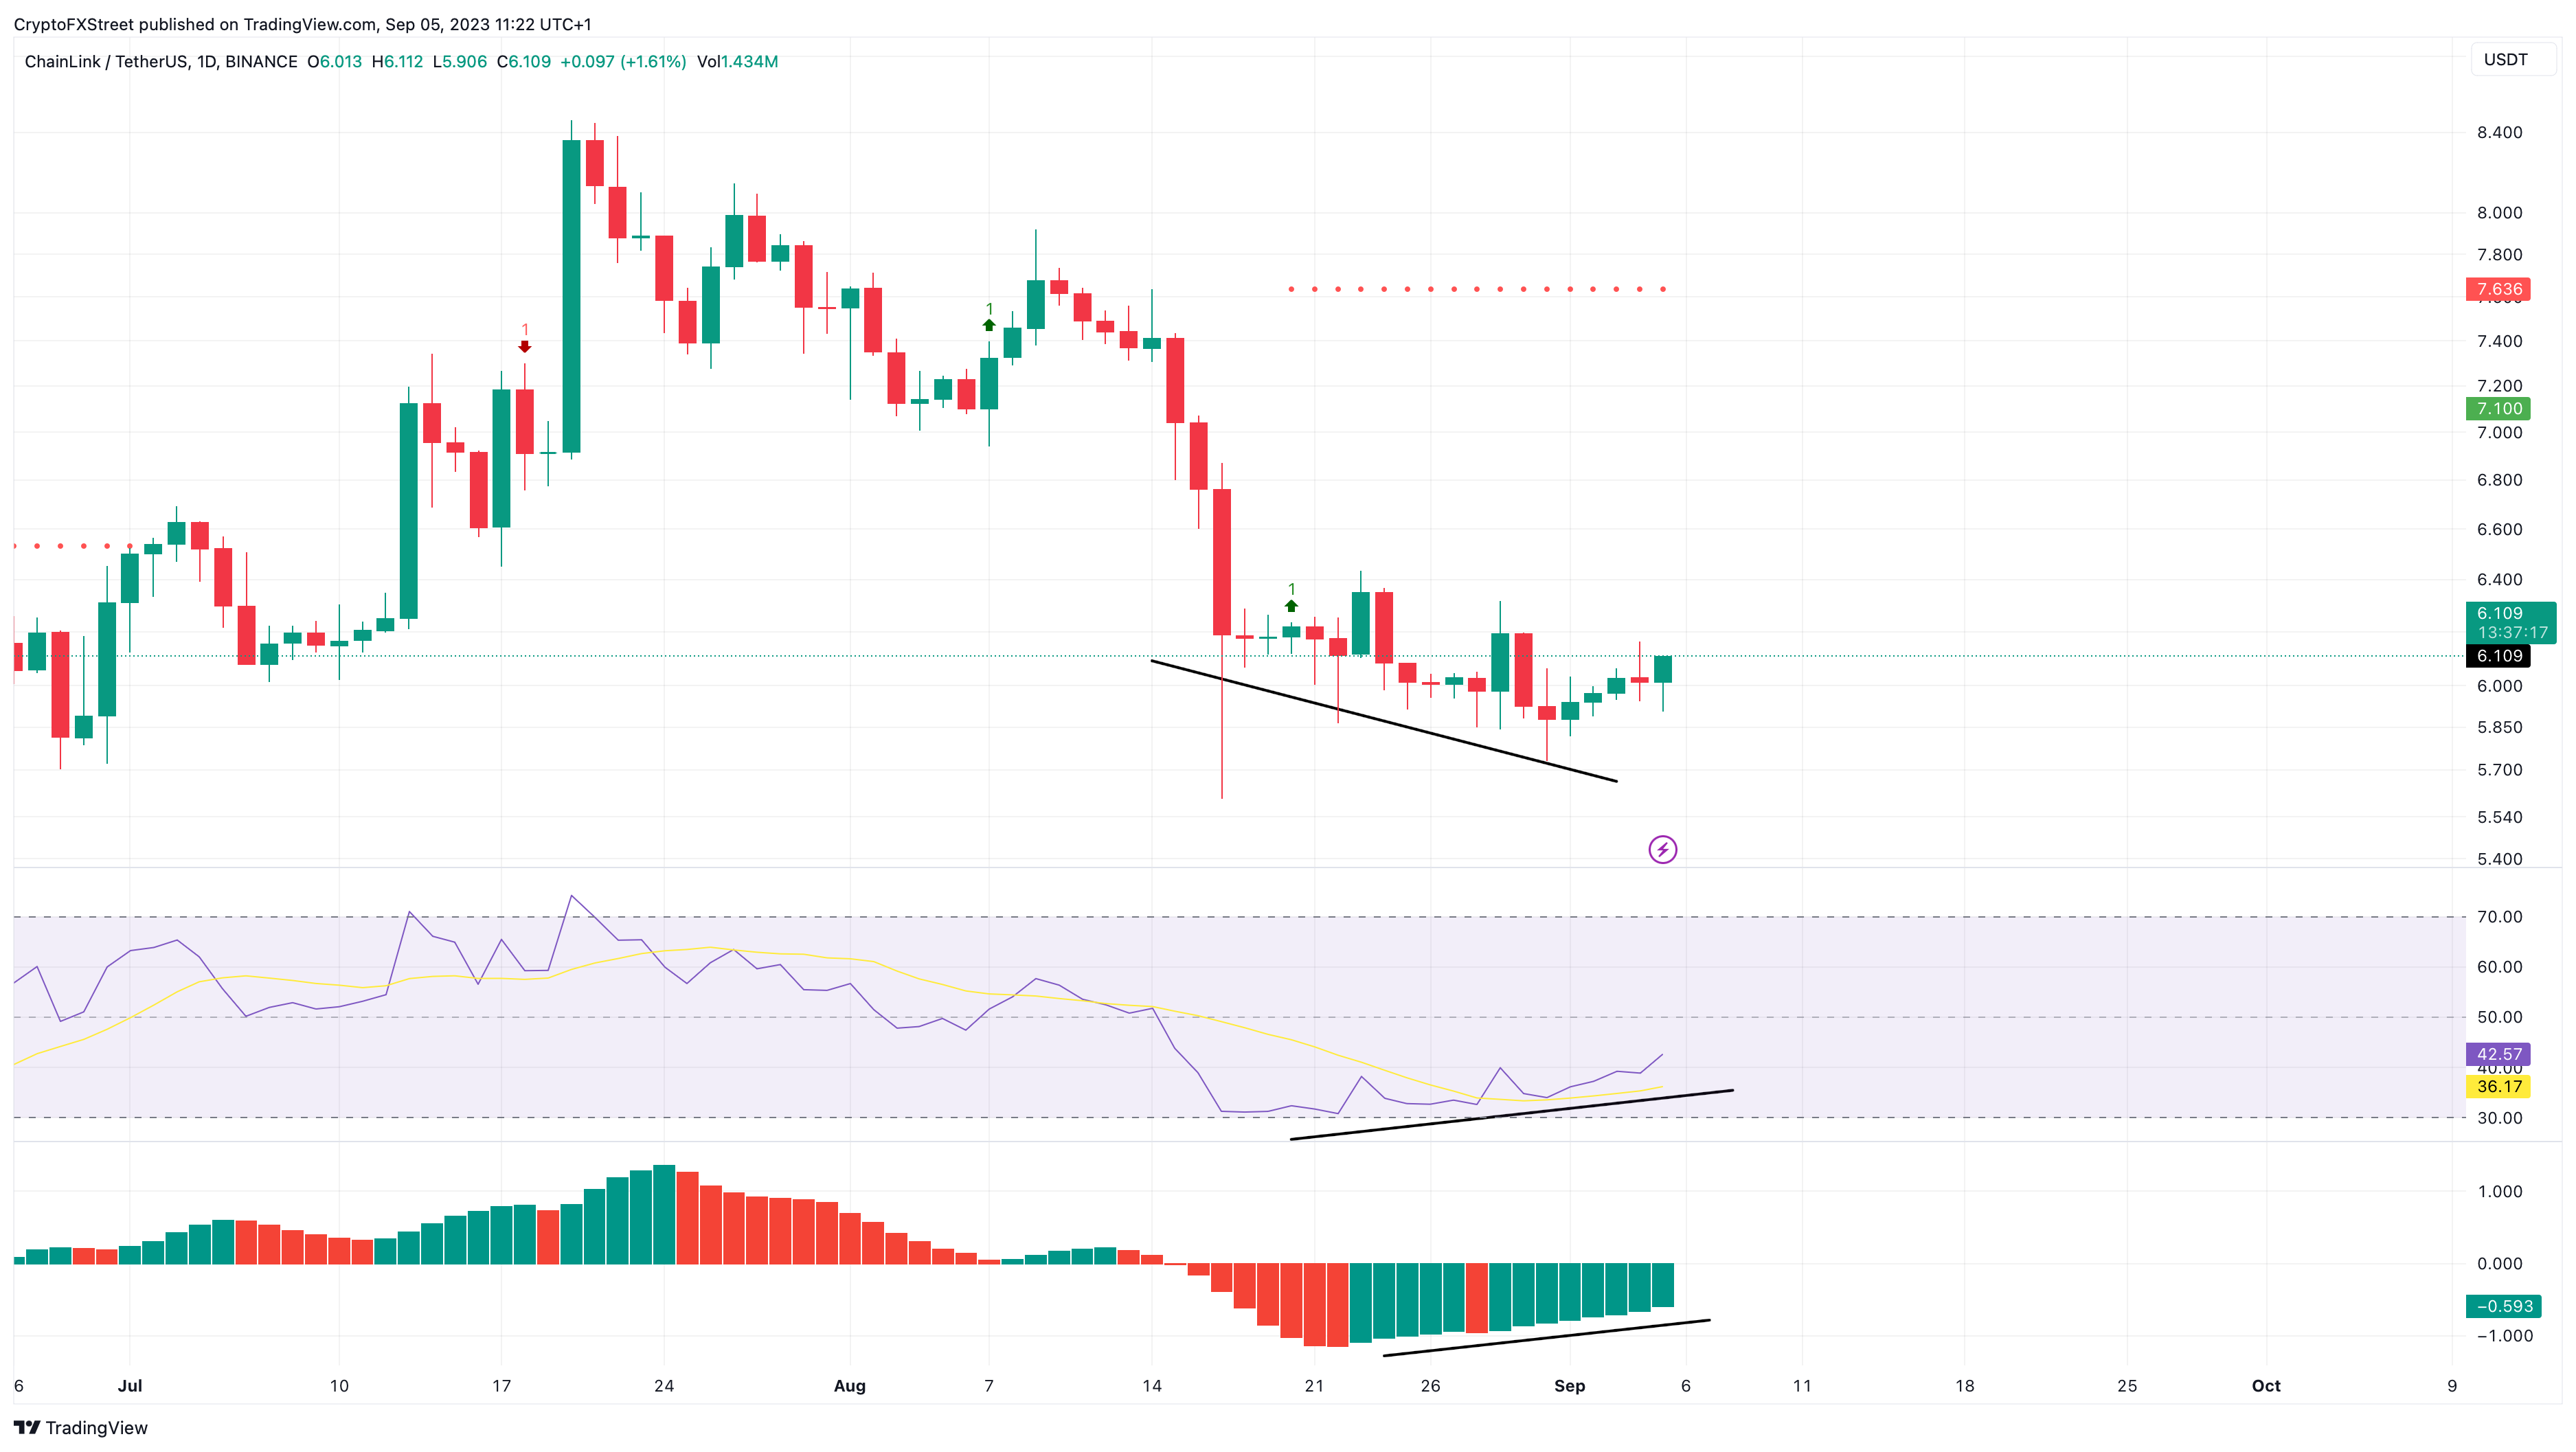
LINK/USDT 1-day chart
Despite a bullish outlook on the weekly, three-day and daily timeframes, investors need to note that the 20-week SMA at $6.502 will be a critical resistance level. Clearing this key hurdle will allow LINK bulls to extend their rally. Failure to do so could result in a steep 15% correction to the three-day support floor at $5.242.
A breakdown of this foothold at $5.242 on the weekly or the three-day chart, followed by a decisive candlestick close below it, will invalidate the bullish outlook. This move would produce a lower low and potentially knock Chainlink price down by 40% to the next key support at $3.030.
Read more: LINK holders’ patience could pay off as Chainlink price likely to initiate recovery
Like this article? Help us with some feedback by answering this survey:
Author

Akash Girimath
FXStreet
Akash Girimath is a Mechanical Engineer interested in the chaos of the financial markets. Trying to make sense of this convoluted yet fascinating space, he switched his engineering job to become a crypto reporter and analyst.


