- Chainlink price remains contained inside a broadening wedge pattern on the 12-hour chart.
- The digital asset has defended a key support level and aims for a significant upswing.
- Various indicators show that LINK faces weak resistance ahead.
Chainlink price has been trading inside an uptrend on the 12-hour chart since February 26 and aims for a significant leg up as it faces weak resistance above its current price.
Chainlink price is primed for a 40% upswing
On the 12-hour chart, Chainlink remains bounded inside an ascending broadening wedge pattern. The 100-SMA support level was held in the past 24 hours as bulls aim for a breakout above $32 towards new all-time highs.
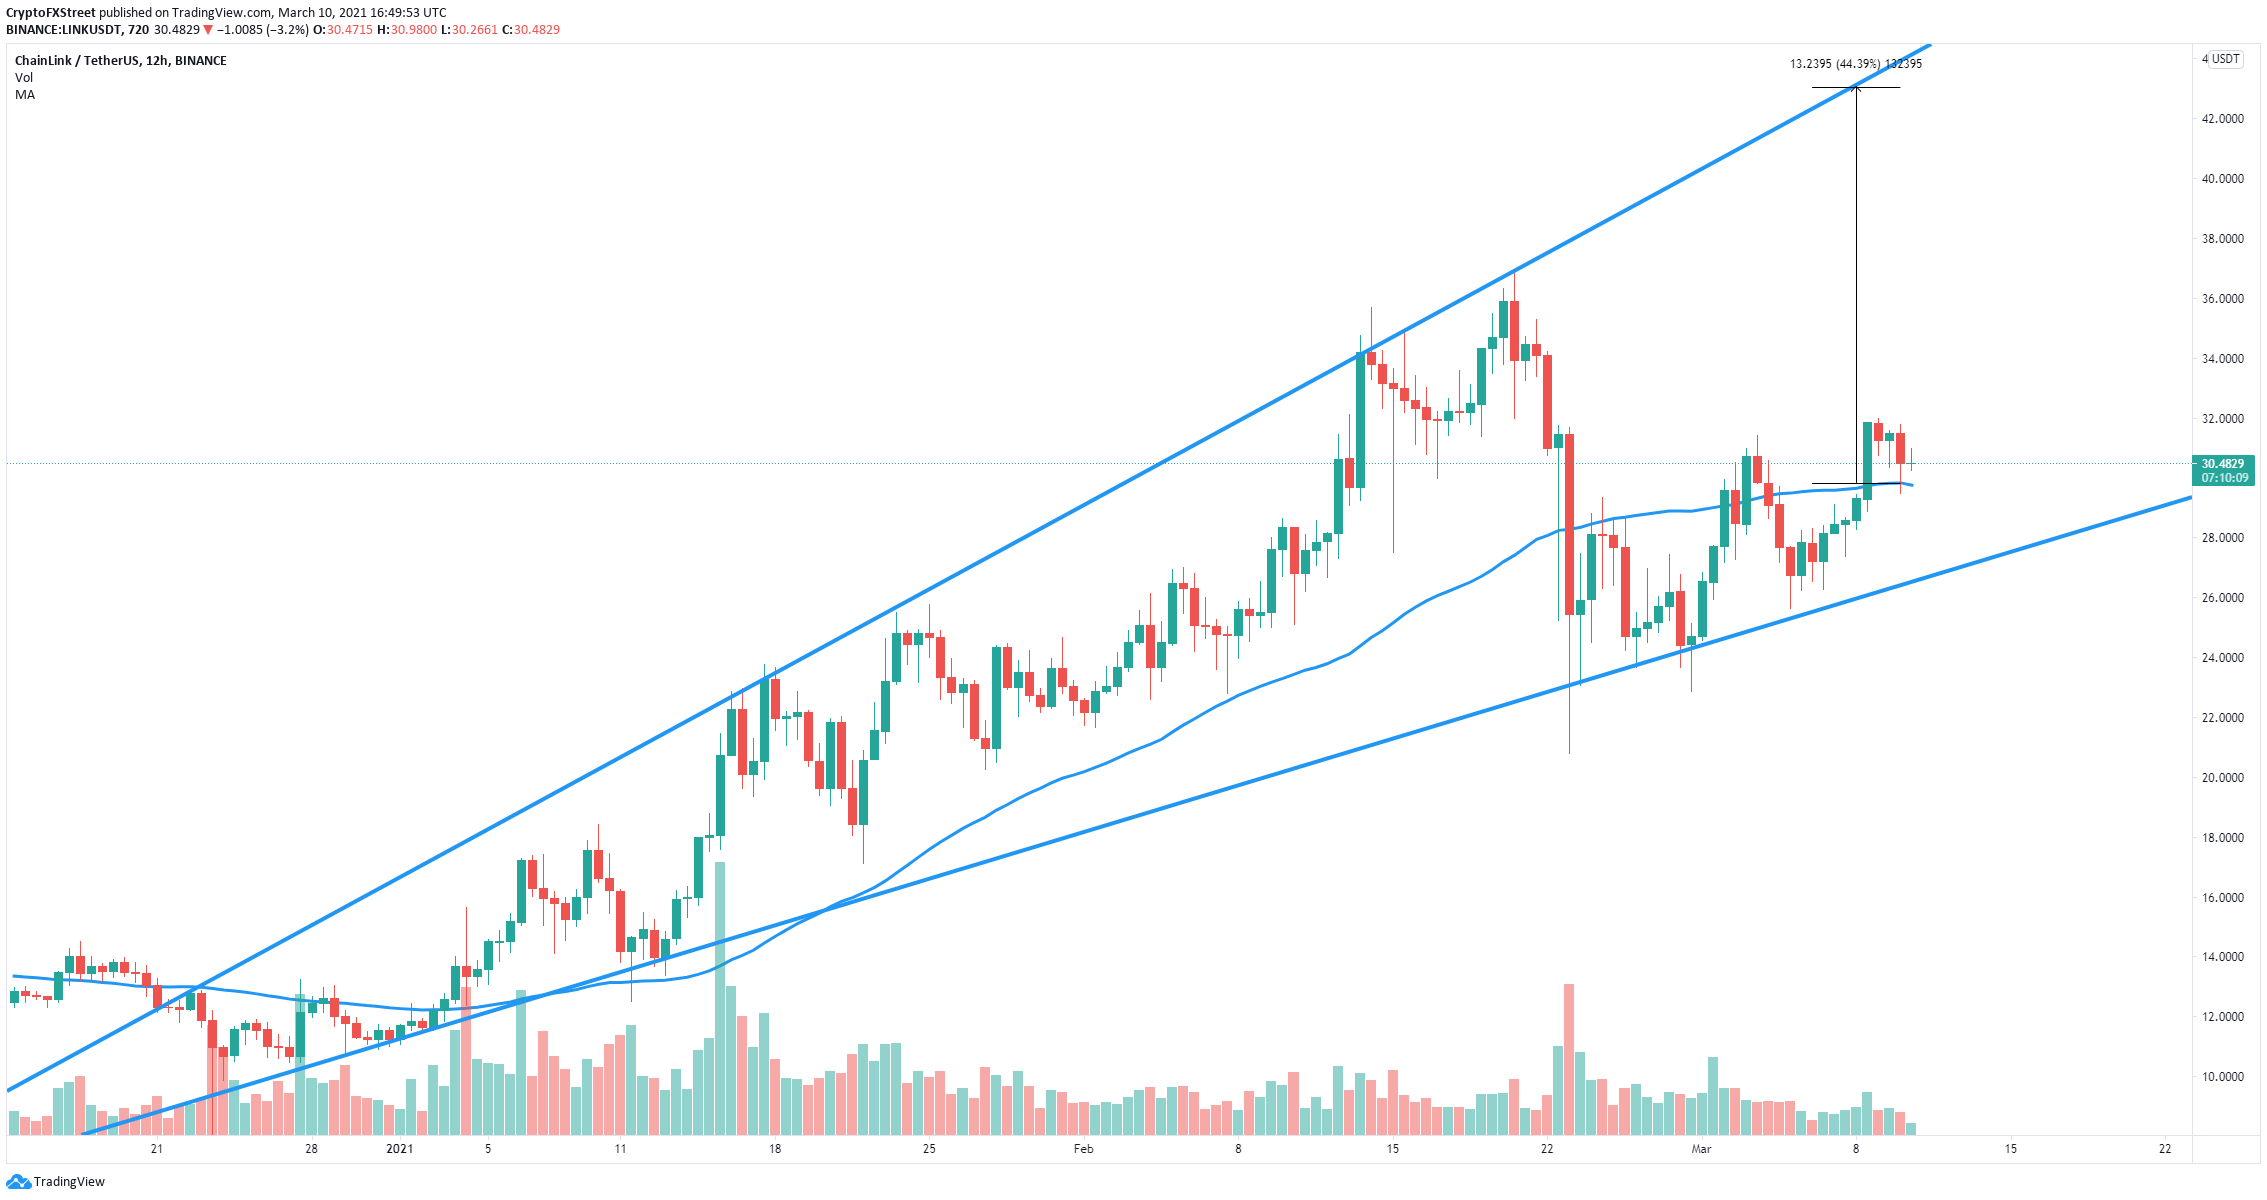
LINK/USD 12-hour chart
The long-term price target is located at $43, which is the upper trendline of the pattern. The In/Out of the Money Around Price (IOMAP) chart shows almost no significant barriers above $31.
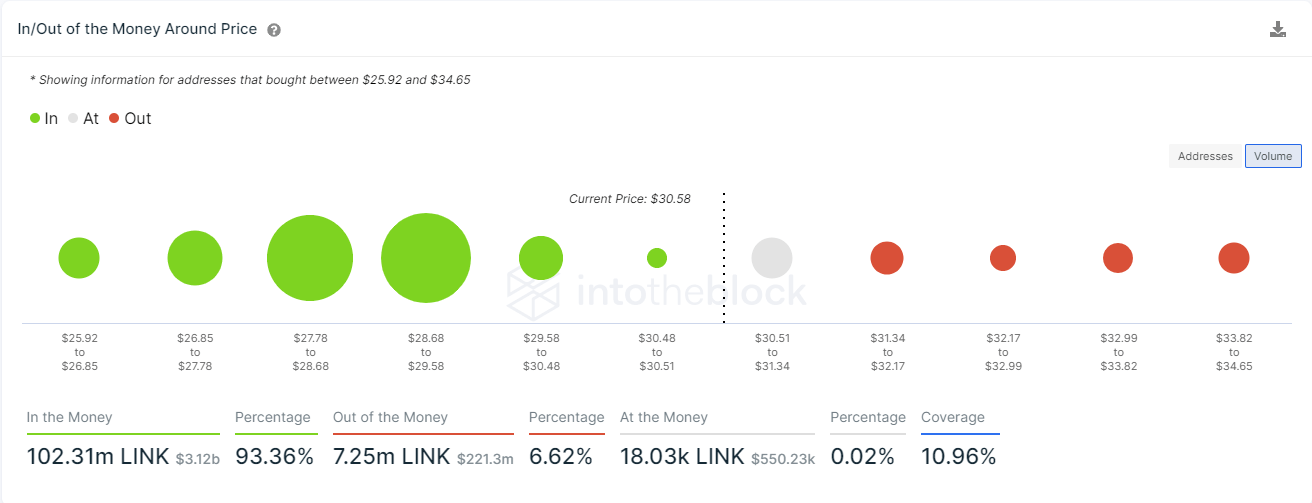
LINK IOMAP chart
On the way down, Chainlink has a ton of support between $29.5 and $27.7 with 82 million LINK in trading volume. However, losing this key support area will represent a breakdown of the ascending wedge pattern and a potential 40% fall towards $16.
Note: All information on this page is subject to change. The use of this website constitutes acceptance of our user agreement. Please read our privacy policy and legal disclaimer. Opinions expressed at FXstreet.com are those of the individual authors and do not necessarily represent the opinion of FXstreet.com or its management. Risk Disclosure: Trading foreign exchange on margin carries a high level of risk, and may not be suitable for all investors. The high degree of leverage can work against you as well as for you. Before deciding to invest in foreign exchange you should carefully consider your investment objectives, level of experience, and risk appetite. The possibility exists that you could sustain a loss of some or all of your initial investment and therefore you should not invest money that you cannot afford to lose. You should be aware of all the risks associated with foreign exchange trading, and seek advice from an independent financial advisor if you have any doubts.
Recommended Content
Editors’ Picks
Worldcoin Price Prediction: Is WLD done with uptrend after 77% rally?

Worldcoin has paused its uptrend as it currently trades at $1.57. This move comes after the altcoin rallied a whopping 77% in just three days, between September 13 and 16. As WLD hovers aimlessly, investors need to be patient to catch the next volatile move.
Ethereum whales prepare ahead of futures Ethereum ETF approval on October 2

Ethereum (ETH) price is likely going to witness a massive spike in volatility soon due to the circumstances surrounding the approval of the token’s futures Exchange-Traded Fund (ETF). According to Twitter users, the ETF is likely going to be approved on October 2.
Ripple Price Forecast: Declining network growth and underwater XRP holders suggest more downside for XRP price

Ripple (XRP) price shows a lack of buying pressure after its win against the US Securities and Exchange Commission (SEC) on July 13. Since then, the remittance token has been on a downtrend. Considering Ripple’s current position, a further decline would not be surprising.
Chainlink Price Prediction: LINK bears set to wipe 25% gains
-637336005550289133_XtraSmall.jpg)
Chainlink price shows an exhaustion of the bullish momentum as it approaches a key reversal zone. This development could see LINK trigger a steep correction that could undo recent gains.
Bitcoin: BTC downside likely after 20-week EMA culls bulls

Bitcoin (BTC) bearish price fractal, as discussed in a previous article, is underway, but the lack of volatility is causing ambiguity and doubt. Regardless, BTC might see a bit of an upside before the long-term bearish scenario plays out.