Chainlink price could rise 45% after sustained support-resistance flips as LINK sentiment changes
- Chainlink price has successfully flipped two resistance levels into support, confirming a change in market sentiment.
- LINK could climb 45% to the next target at $28.71 as buyers show strength.
- A candlestick close below $13.08 would invalidate the bullish thesis.

Chainlink (LINK) price is trading with a bullish bias after a strong breakout in October. The altcoin is rallying alongside the broader market, with prospects for more gains as LINK bulls continue to show buyers strength.
Also Read: Chainlink price prepares for breakout, eyes $20 after successful retest
Chainlink price could rally 45%
After a solid breakout from a 550-day consolidation, Chainlink price is following alongside an ascending parallel channel. This bullish technical formation has seen LINK price flip two resistance levels into support at $13.08 and $16.86, respectively.
This support-resistance flip suggests a change in market sentiment from bearish to bullish, with the previous resistance level, which was capping the price movement, becoming a new support level that the price may bounce off.
Traders may consider entering long positions when the price successfully retests this level and holds above it, confirming the flip from resistance to support.
For the Chainlink price, the level has been retested, and now the altcoin may be poised for a strong move north. In such a case, the next likely target is the $28.71 resistance level, last tested in January 2022.
Multiple technical indicators stand in alignment, starting with the Relative Strength Index (RSI) that is northbound with a pending buy signal. If buying pressure increases, the RSI could cross above the yellow band of its signal line, a crossover that is seen as bullish.
Both the Awesome Oscillator (AO) and the Moving Average Convergence Divergence (MACD) are also in positive territory, typically indicating a strong bullish momentum in the market.
Based on the position of both these momentum indicators above their zero lines — one a trend-following momentum and the other measuring market momentum — traders and investors may interpret this as a strong signal to consider entering long positions or holding onto existing positions in anticipation of continued price appreciation.
A move to the $28.71 target would constitute a 45% climb above current levels. In a highly bullish case, the gains could have Chainlink price extrapolate to the $37.00 resistance level last tested in November 2021.
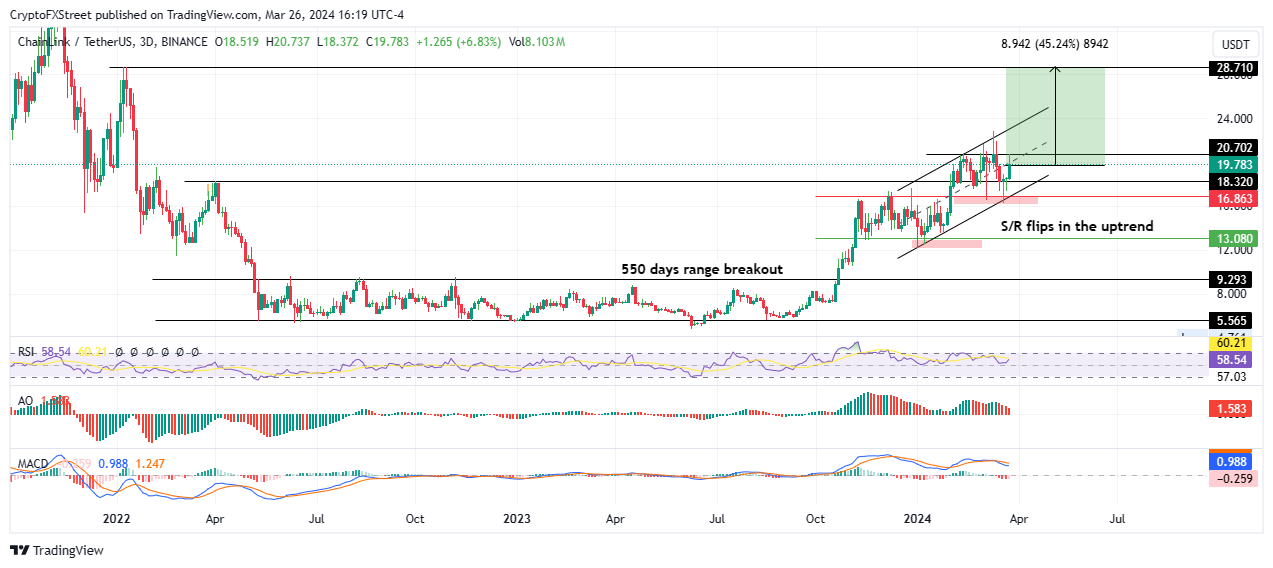
LINK/USDT 3-day chart
On the other hand, a rejection from the midline of the channel could see Chainlink price drop below the $18.32 support. If this level fails to hold as support, the altcoin could slump to retest the $16.86 support.
In a dire case, LINK price could descend below $13.08, below which the bullish thesis would be invalidated.
Author

Lockridge Okoth
FXStreet
Lockridge is a believer in the transformative power of crypto and the blockchain industry.


