Chainlink Price Analysis: LINK consolidates above $10.50 between strong support and resistance levels
- The 100-day SMA has crossed above the 50-day SMA to chart the bearish cross.
- The MACD shows decreasing bullish momentum.
-637336005550289133.jpg)
LINK enjoyed a bullish rally between October 7 and October 12, wherein it rose from $8.80 to $11.45. After getting rejected to the 50-day SMA, the decentralized oracle platform has dropped to $10.55. In the process, LINK has broken below the 100-day SMA.
LINK/USD daily chart
-637385018744375306.png)
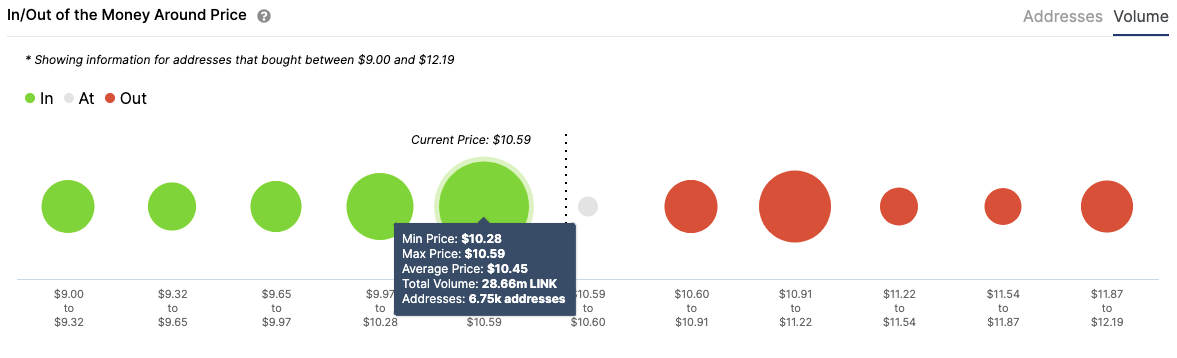
The 100-day SMA has crossed above the 50-day SMA to chart the bearish cross pattern. Adding further credence to the bearish outlook is the MACD, which shows decreasing bullish momentum. As per the IOMAP, the price is sitting on top of healthy support at $10.35, wherein 6,750 addresses had purchased 29 million LINK.
LINK IOMAP
If the price breaks below this level, LINK bears will next have to contend with a moderate support wall at $10.35. If the price breaks below all these zones, it will be quite catastrophic since it will drop down to the 200-day SMA ($7.50). The whales have also contributed to this selling pressure.
LINK holders distribution
 [07.59.32, 17 Oct, 2020]-637385017909581083.png)
The number of addresses holding 1 million to 10 million tokens went down from 51 on October 8 to 59 on October 10. Since then, the whales have remained dormant.
The Flipside: Can the bulls take back control?
As per the daily chart, LINK faces immediate resistance at $11.15, which is the point of intersection of the aforementioned bearish cross. If LINK breaks above that, it should move to $12 before facing a moderate resistance obstacle. A break above these obstacles should take the price up to $14.
Key price levels to watch
If LINK breaks below the $10.35 support level, a lack of moderate and robust walls should take the price down to the 200-day SMA ($7.50).
If LINK bulls somehow manage to get enough momentum to break above the $11.15 resistance line, the price will be able to reach $14.
Author

Rajarshi Mitra
Independent Analyst
Rajarshi entered the blockchain space in 2016. He is a blockchain researcher who has worked for Blockgeeks and has done research work for several ICOs. He gets regularly invited to give talks on the blockchain technology and cryptocurrencies.


