Chainlink Price Prediction: LINK recovery hits pause amid hovering reversal to $10
- Chainlink could resume the downtrend back to $10 if the 200 SMA support in the 12-hour timeframe is broken.
- LINK/USD short-term consolidation likely to take precedence ahead of another breakout.
-637336005550289133.jpg)
Chainlink has printed a remarkable recovery over the last seven days. Bulls regained control of the price after LINK embraced support marginally above $7. However, they struggled at $9 before a breakout from a descending parallel channel came into the picture. At the time of writing, LINK/USD is trading at $11.2 after a shallow retreat from highs close to $12.
Chainlink prepares to plunge
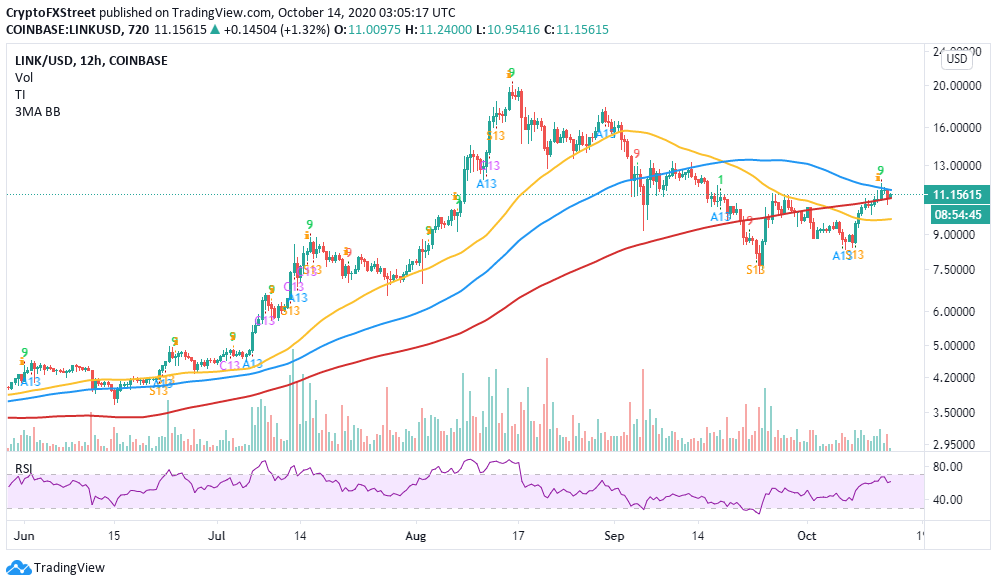
The TD Sequential indicator presented a sell signal in the 12-hour timeframe. A minor retracement saw the decentralized oracle token embrace short term support at the 200 Simple Moving Average. The sell signal could be validated further if the 200 SMA gives in, allowing the price to freefall further. The 50 SMA is in line to absorb most of the selling pressure, which will help avert declines below $10.
LINK/USD 12-hour chart
On the daily chart, consolidation is brought into the picture by a leveling Relative Strength Index (RSI). In other words, Chainlink could remain relatively in the same position until a breakout materializes. The 50-day SMA limits upward movement; on the flip side, the 200-day SMA provides immediate support.
LINK/USD daily chart
-637382436821420478.png)
IntoTheBlock's "Daily New Addresses" metric shows the number of new addresses joining the network is starting to go down. For instance, a spike to approximately 2,200 new addresses on October 12 failed to continue with the uptrend, leading to a slump to roughly 1,800 on October 13. An increase in the number of new addresses joining the network is a bullish indicator for the project and the token's value. On the other hand, a downtrend tends to correlate with declining prices in the near future.
Chainlink New Addresses chart
-637382437148961327.png)
Looking at the other side of the picture
It is worth mentioning that the TD Sequential indicator's sell signal might be invalidated by the support at the 200 SMA in the 12-hour timeframe. Moreover, a horizontal RSI on the daily chart points towards possible consolidation ahead of another breakout. It is essential to wait for a confirmed spike below the 200 SMA for losses towards $10 or above the 100 SMA (12-hour timeframe) for gains back to $12.
Author

John Isige
FXStreet
John Isige is a seasoned cryptocurrency journalist and markets analyst committed to delivering high-quality, actionable insights tailored to traders, investors, and crypto enthusiasts. He enjoys deep dives into emerging Web3 tren


