|

Cardano Elliott Wave technical analysis [Video]

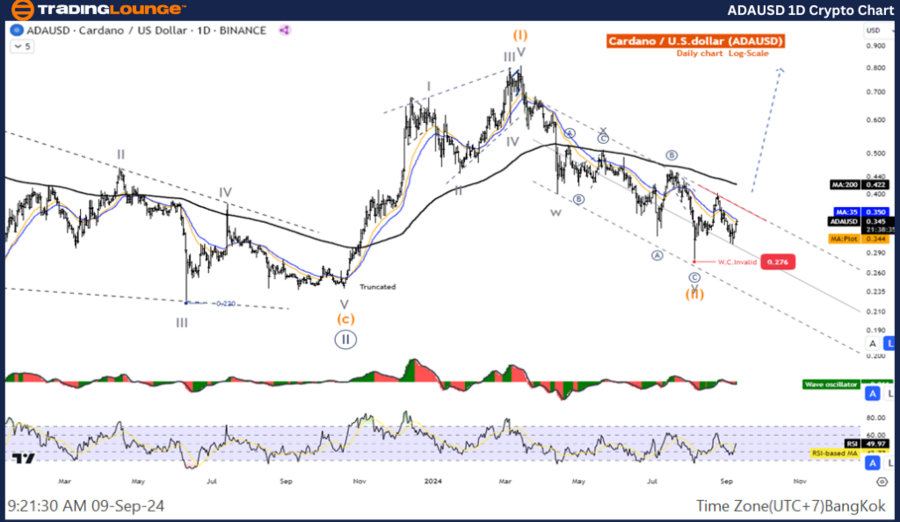
ADA/USD Elliott Wave technical analysis

Function: Counter Trend

Mode: Corrective

Structure: Double Corrective

Position: Wave Y

Direction next higher degrees: wave (II)

Details: The decline of wave Y is likely to end and the price is re-entering the uptrend.

Cardano/U.S. dollar (ADAUSD)Trading Strategy: It looks like the wave (II) correction is complete and the price is still likely to move up. Look for an opportunity to join the wave (III) uptrend.

Cardano/U.S. dollar (ADAUSD)Technical Indicators: The price is below the MA200 indicating a downtrend, The Wave Oscillator is a Bearish Momentum.
ADAUSD

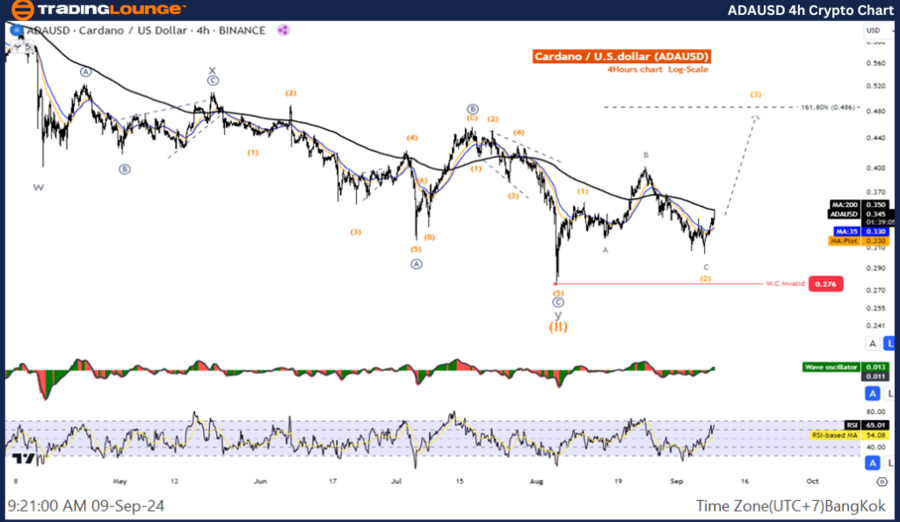
ADA/USD Elliott Wave technical analysis 

Function: Counter Trend

Mode: Corrective

Structure: Zigzag

Position: Wave C

Direction next higher degrees: Wave (2) of Impulse

Details: Wave (2) is likely to end and the price is re-entering the uptrend.

Cardano / U.S. dollar (ADAUSD) Trading Strategy: It looks like the wave 2 correction is complete and the price is still likely to move up. Look for an opportunity to join the wave 3 uptrend.

Cardano / U.S. dollar (ADAUSD) Technical Indicators: The price is below the MA200indicating a downtrend, The Wave Oscillator is a Bearish Momentum.
ADAUSD

Cardano Elliott Wave technical analysis [Video]

Author

Peter Mathers

Peter Mathers

TradingLounge

Peter Mathers started actively trading in 1982. He began his career at Hoei and Shoin, a Japanese futures trading company.


More from Peter Mathers
Share:

Editor's Picks

Cardano Price Forecast: ADA extends gains after Mastercard deal, Leios testing

Cardano price extends a steady near-term recovery on Monday, inching closer to the long-term 200-day EMA near $0.2464. The recent partnership with Mastercard and the Leios upgrade testing lift ADA investors' spirits. The technical outlook for ADA shows an upside bias as bullish momentum recovers.

Crypto Overview: Bitcoin reclaims $80,000 – Venice Token and NEAR Protocol rally

Bitcoin is trading above $81,000 holding firm after a 6% surge on Friday, linked to US financial watchdogs' efforts to structure crypto assets under existing rules following the CLARITY Act's failure to advance. Venice and NEAR Protocol have posted double-digit gains over the last 24 hours, scaling to fresh annual highs.

Top 3 Price Prediction: BTC extends gains, ETH and XRP advance in uptrend

Bitcoin, Ethereum, and Ripple extend their gains after posting strong gains of over 5%, 6% and 5%, respectively, last week. BTC trades above $81,300, ETH climbs above $2,600, and XRP holds above the key $1.300 support level. All three momentum indicators suggest early bullish momentum and hint at further gains ahead.

Bitcoin pushes above $81K, faces liquidation test between $83K and $86K
Bitcoin (BTC) rose above $81,000 on Friday after climbing back above the True Market Mean, signaling that the market could potentially have moved back into a bullish regime. The True Market Mean, at $76,660, represents the average price paid by active trading participants. BTC’s move back above the level often signals a return to bullish territory and can trigger positive short-term sentiment.
Bitcoin: BTC shrugs off CLARITY Act setback and hawkish Fed
Bitcoin (BTC) price action has remained resilient this week, trading above $78,000 at the time of writing on Friday, heading toward a key resistance zone. Institutional demand shows early signs of weakness, with spot Exchange Traded Funds (ETFs) on track for a second straight week of outflows, with over $420 million recorded through Thursday amid escalating Middle East tensions.


