• Cardano price is coiling into a wedge-like pattern.
  • ADA price has printed three impulsive waves.
  • An invalidation for the bullish narrative will be a touch at $1.13.

Cardano price action could fool many traders as the price action is displaying mixed signals. Traders should dive deeper into the technicals before placing an entry.

Cardano price action has “Sneaky Smart Money” written all over it

Cardano price has begun forming a wedge-like pattern since March 18th that many traders refer to as an ending diagonal. Ending diagonals are usually in wave five positions and are historically known for being the last pattern to ascend the price before a correction occurs. 

Many counter-trend traders enjoy ending diagonal patterns because of the impulsive counter-trend rallies they bring forth. Traders may also be noticing the Relative Strength Index has a diverging wedge pattern on the 8-hour chart. This scenario could be enticing traders to place prominent short positions on Cardano price, targeting $1.15 and even $1.07.
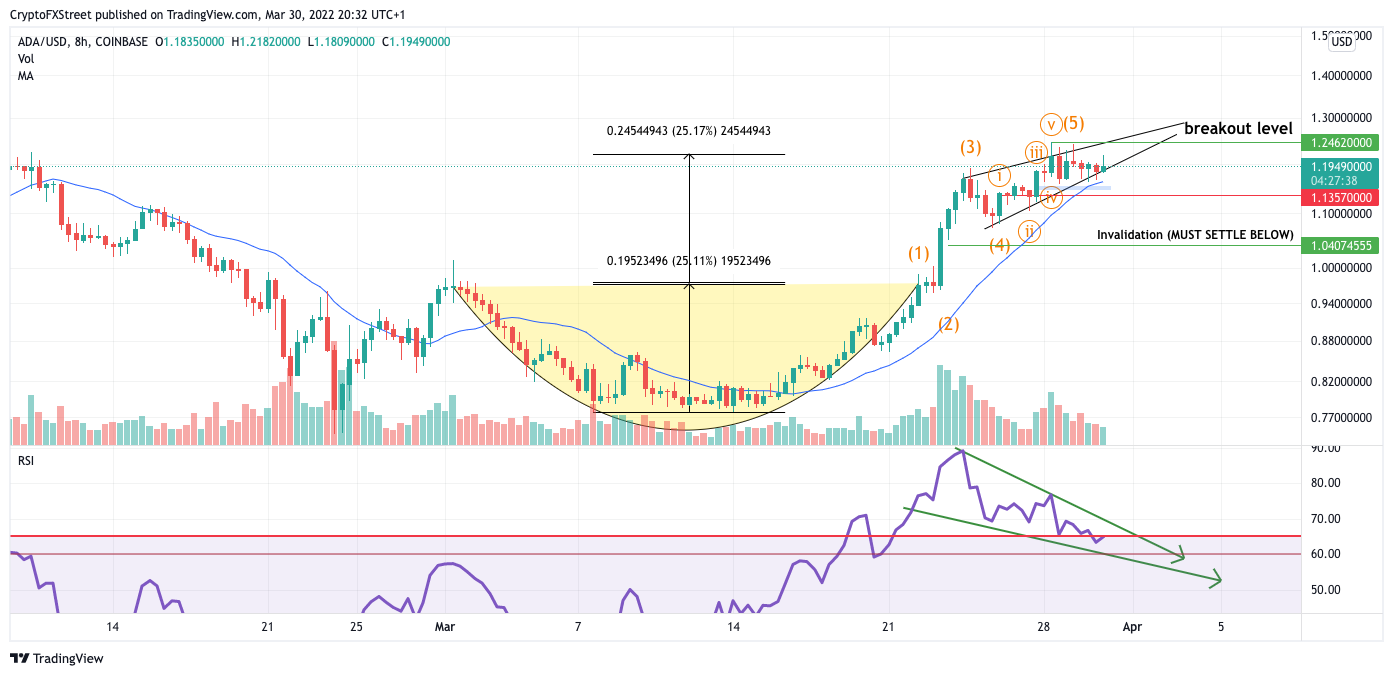
ada/3/30/22 pt2

ADA/USD 8-Hr Chart

However, the wedge-like pattern may be a bear trap when analyzing the ADA price action on the 2-hour chart. Shorters looking for the 10% move south may get fooled as the wedge pattern breaks a golden rule for ending diagonals. 

Termination triangles cannot have an impulsive wave within the pattern. 

Cardano price action does make an impulsive wave where waves 1, 3 and 5 are impulsive while wave four does not fall into the wave one position. This scenario may be early evidence of “Smart Money Involvement” looking to trap leveraged traders on the wrong side of the trade. 

Thus, traders should continue with an overall bullish bias as the Cardano price has successfully established three impulse waves. A breach of the highs at $1.25 could be followed by an upswing to the next target of $1.35. 
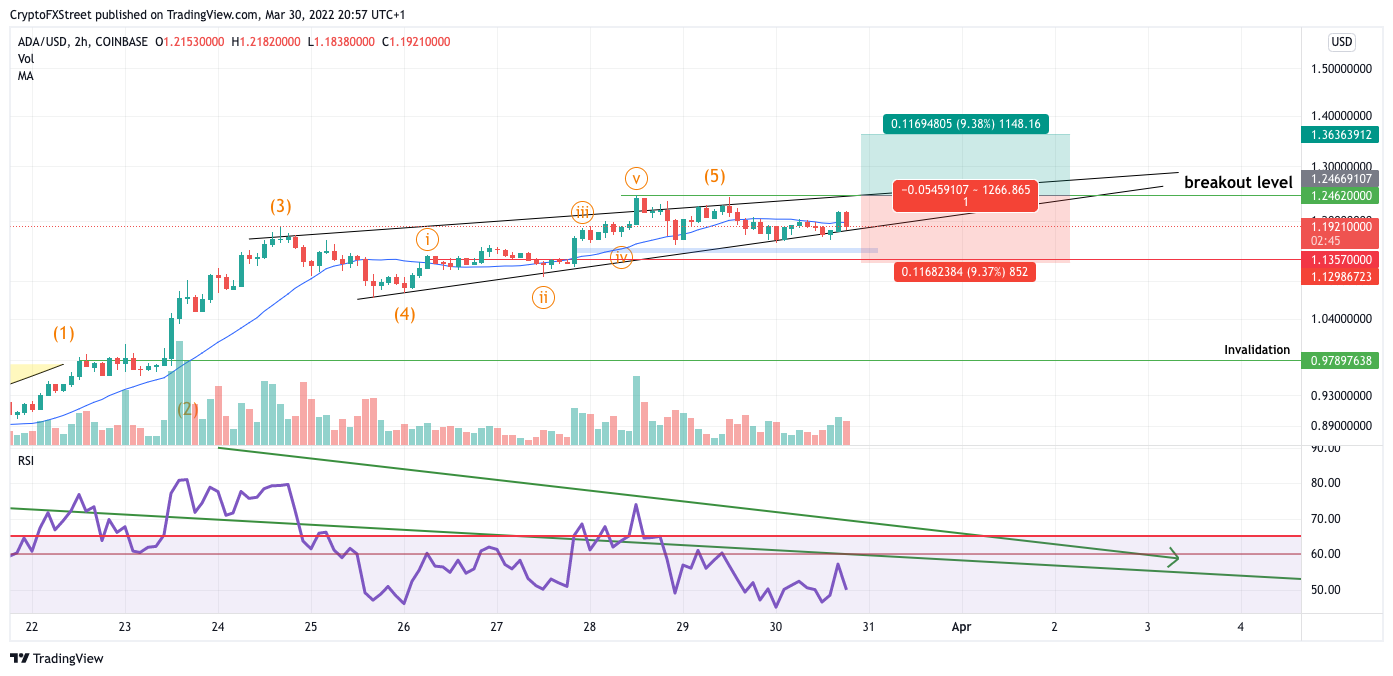
ada/3/30/222

ADA/USD 2-Hr Chart

An invalidation for the bullish bias will be a touch of the $1.13 price point. If this were to occur, Cardano price could continuously fall between $1 and $0.97, representing a 17% correction from the current levels.


Information on these pages contains forward-looking statements that involve risks and uncertainties. Markets and instruments profiled on this page are for informational purposes only and should not in any way come across as a recommendation to buy or sell in these assets. You should do your own thorough research before making any investment decisions. FXStreet does not in any way guarantee that this information is free from mistakes, errors, or material misstatements. It also does not guarantee that this information is of a timely nature. Investing in Open Markets involves a great deal of risk, including the loss of all or a portion of your investment, as well as emotional distress. All risks, losses and costs associated with investing, including total loss of principal, are your responsibility. The views and opinions expressed in this article are those of the authors and do not necessarily reflect the official policy or position of FXStreet nor its advertisers. The author will not be held responsible for information that is found at the end of links posted on this page.

If not otherwise explicitly mentioned in the body of the article, at the time of writing, the author has no position in any stock mentioned in this article and no business relationship with any company mentioned. The author has not received compensation for writing this article, other than from FXStreet.

FXStreet and the author do not provide personalized recommendations. The author makes no representations as to the accuracy, completeness, or suitability of this information. FXStreet and the author will not be liable for any errors, omissions or any losses, injuries or damages arising from this information and its display or use. Errors and omissions excepted.

The author and FXStreet are not registered investment advisors and nothing in this article is intended to be investment advice.

Join Telegram

Recommended content


Recommended Content

Editors’ Picks

TRON gains 10% in 2024, supply of stablecoins reaches over $50 billion in Q1

TRON gains 10% in 2024, supply of stablecoins reaches over $50 billion in Q1

TRON, a blockchain-based digital platform, has seen positive growth in the first quarter of 2024, as seen in a Messari report. TRON noted gains across several metrics like market capitalization, revenue and total value locked. 

More Tron News

XRP hovers near $0.50 as Ripple CTO addresses concerns related to stablecoin launch

XRP hovers near $0.50 as Ripple CTO addresses concerns related to stablecoin launch

XRP is hovering near $0.53 on Friday, spending nearly all week below $0.55. Ripple CTO David Schwartz addressed concerns on stablecoin and XRP utility on Thursday. 

More Ripple News

Terraform Labs set to restrict access for users in the US after recent ruling in SEC lawsuit

Terraform Labs set to restrict access for users in the US after recent ruling in SEC lawsuit

Blockchain company Terraform Labs said Thursday that it will restrict access to some of its products and services for US-based users as it expects to receive a court order soon in light of its legal battle against the US Securities and Exchange Commission (SEC).

More Terra News

Bitcoin Weekly Forecast: BTC’s next breakout could propel it to $80,000 Premium

Bitcoin Weekly Forecast: BTC’s next breakout could propel it to $80,000

Bitcoin’s (BTC) recent price consolidation could be nearing its end as technical indicators and on-chain metrics suggest a potential upward breakout. However, this move would not be straightforward and could punish impatient investors. 

More Bitcoin News

Bitcoin: BTC’s next breakout could propel it to $80,000 Premium

Bitcoin: BTC’s next breakout could propel it to $80,000

Bitcoin’s (BTC) recent price consolidation could be nearing its end as technical indicators and on-chain metrics suggest a potential upward breakout. However, this move would not be straightforward and could punish impatient investors. 

Read full analysis

BTC

ETH

XRP