Cardano Price Prediction: Despite room for 31% gains, ADA might find it difficult to rally again
- Cardano price corrected over the second half of December but is still sustaining the long-term uptrend.
- The price indicators are suggesting a likely bearish turn of events, exhibiting the first bearish signal in four months.
- A decline below $0.50 could result in the altcoin falling by 20% towards $0.40.

Cardano price noted a significant increase followed by a sharp fall towards the end of December. While it was an expected course of action from the altcoin, the present scenario dictates that the bearishness may not have completely waned off even though there is still room for growth for ADA.
Cardano price recovery could be an uphill task
Cardano price can be seen trading at $0.52 at the time of writing, recovering from the dip in the past two days. On the 3-day chart, ADA is exhibiting the potential to continue its long-term uptrend that began mid-October, as the third-generation cryptocurrency has not lost the support of the 200-day Exponential Moving Average (EMA).
Additionally, the uptrend line has sustained as support, too, after the altcoin successfully hit the target price of $0.68, attained from the double bottom pattern noted in the chart. Despite the correction, this target price can be reclaimed once again as it stands 31% away from the trading price.
However, price indicators, especially the Moving Average Convergence Divergence (MACD), are exhibiting the first bearish signal in nearly four months. The bearish crossover observed on the indicator, combined with the potential bearish impact of funds flowing into Bitcoin following the spot BTC ETF approval, could bring ADA down.
A test of $0.46 is the likely outcome since the 200-day EMA coincides with this price, but prolonged bearishness could drag ADA lower to $0.41 to coincide with the 50-day EMA.
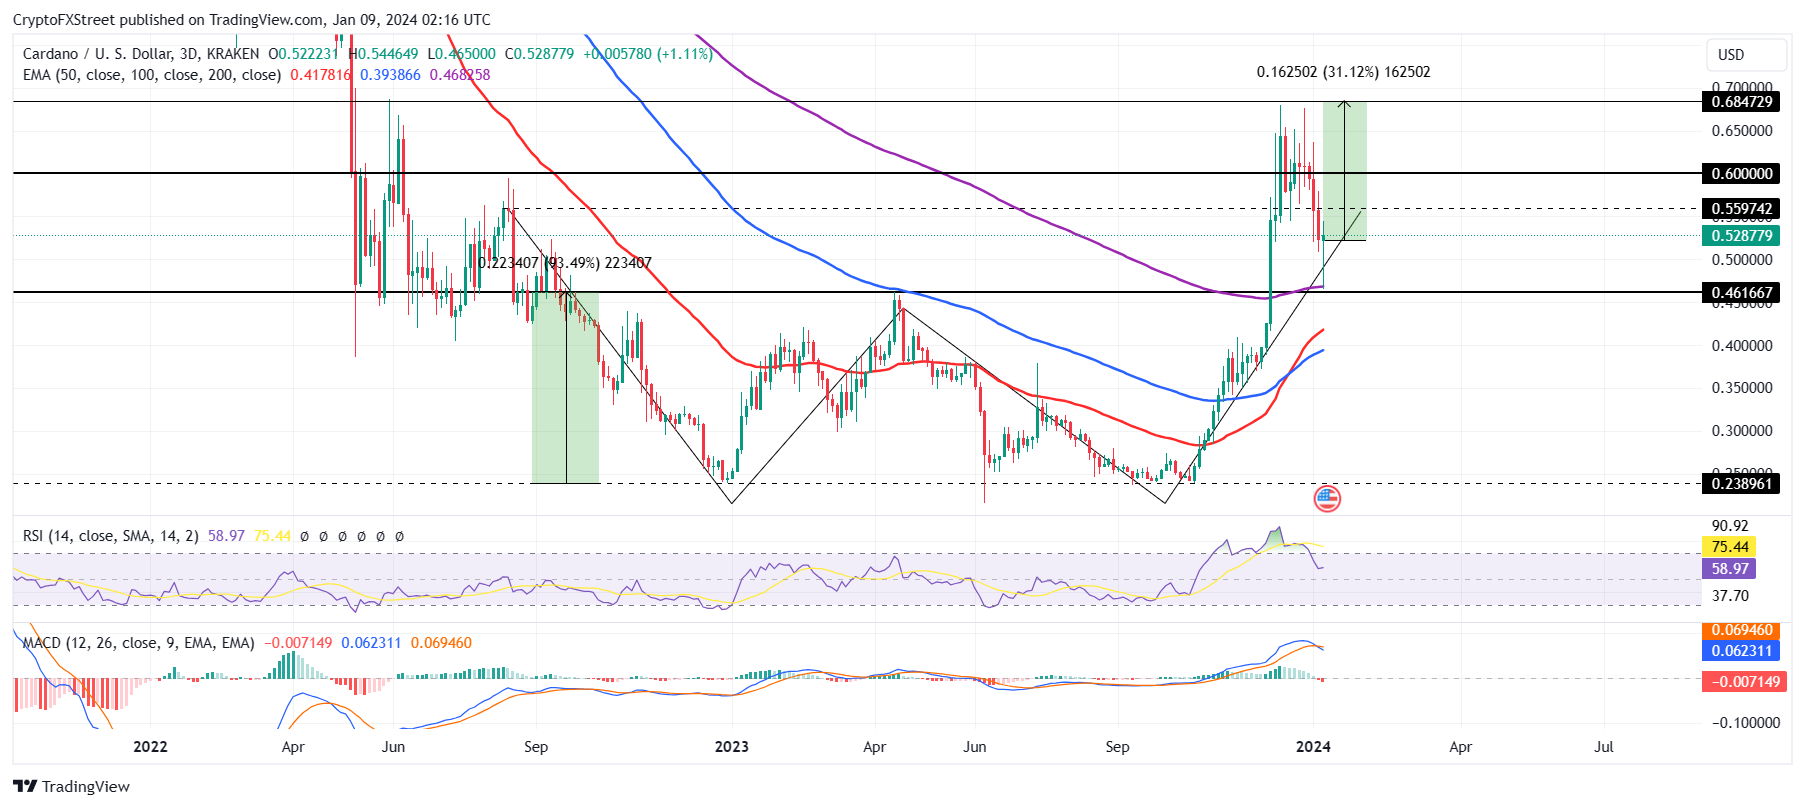
ADA/USD 3-day chart
Nevertheless, if Cardano price bounces off the $0.46 support line and reclaims the resistance at $0.55, it might have a shot at rising towards the target of $0.68. For the same, the $0.60 level must be flipped into support, which would invalidate the bearish thesis.
Cryptocurrency metrics FAQs
What is circulating supply?
The developer or creator of each cryptocurrency decides on the total number of tokens that can be minted or issued. Only a certain number of these assets can be minted by mining, staking or other mechanisms. This is defined by the algorithm of the underlying blockchain technology. Since its inception, a total of 19,445,656 BTCs have been mined, which is the circulating supply of Bitcoin. On the other hand, circulating supply can also be decreased via actions such as burning tokens, or mistakenly sending assets to addresses of other incompatible blockchains.
What is market capitalization?
Market capitalization is the result of multiplying the circulating supply of a certain asset by the asset’s current market value. For Bitcoin, the market capitalization at the beginning of August 2023 is above $570 billion, which is the result of the more than 19 million BTC in circulation multiplied by the Bitcoin price around $29,600.
What is trading volume?
Trading volume refers to the total number of tokens for a specific asset that has been transacted or exchanged between buyers and sellers within set trading hours, for example, 24 hours. It is used to gauge market sentiment, this metric combines all volumes on centralized exchanges and decentralized exchanges. Increasing trading volume often denotes the demand for a certain asset as more people are buying and selling the cryptocurrency.
What is funding rate?
Funding rates are a concept designed to encourage traders to take positions and ensure perpetual contract prices match spot markets. It defines a mechanism by exchanges to ensure that future prices and index prices periodic payments regularly converge. When the funding rate is positive, the price of the perpetual contract is higher than the mark price. This means traders who are bullish and have opened long positions pay traders who are in short positions. On the other hand, a negative funding rate means perpetual prices are below the mark price, and hence traders with short positions pay traders who have opened long positions.
Author

Aaryamann Shrivastava
FXStreet
Aaryamann Shrivastava is a Cryptocurrency journalist and market analyst with over 1,000 articles under his name. Graduated with an Honours in Journalism, he has been part of the crypto industry for more than a year now.



