Cardano Price Forecast: ADA whales’ resilience might catalyze a 30% recovery rally
- Cardano price fell by 17.6% in the past month but is still treading water above $0.46critical support at $0.53.
- ADA whales accumulated $85 million of assets in the last four weeks – a positive – despite a 17% crash.
- On-chain data suggests the time is right to buy as ADA is in the opportunity zone.

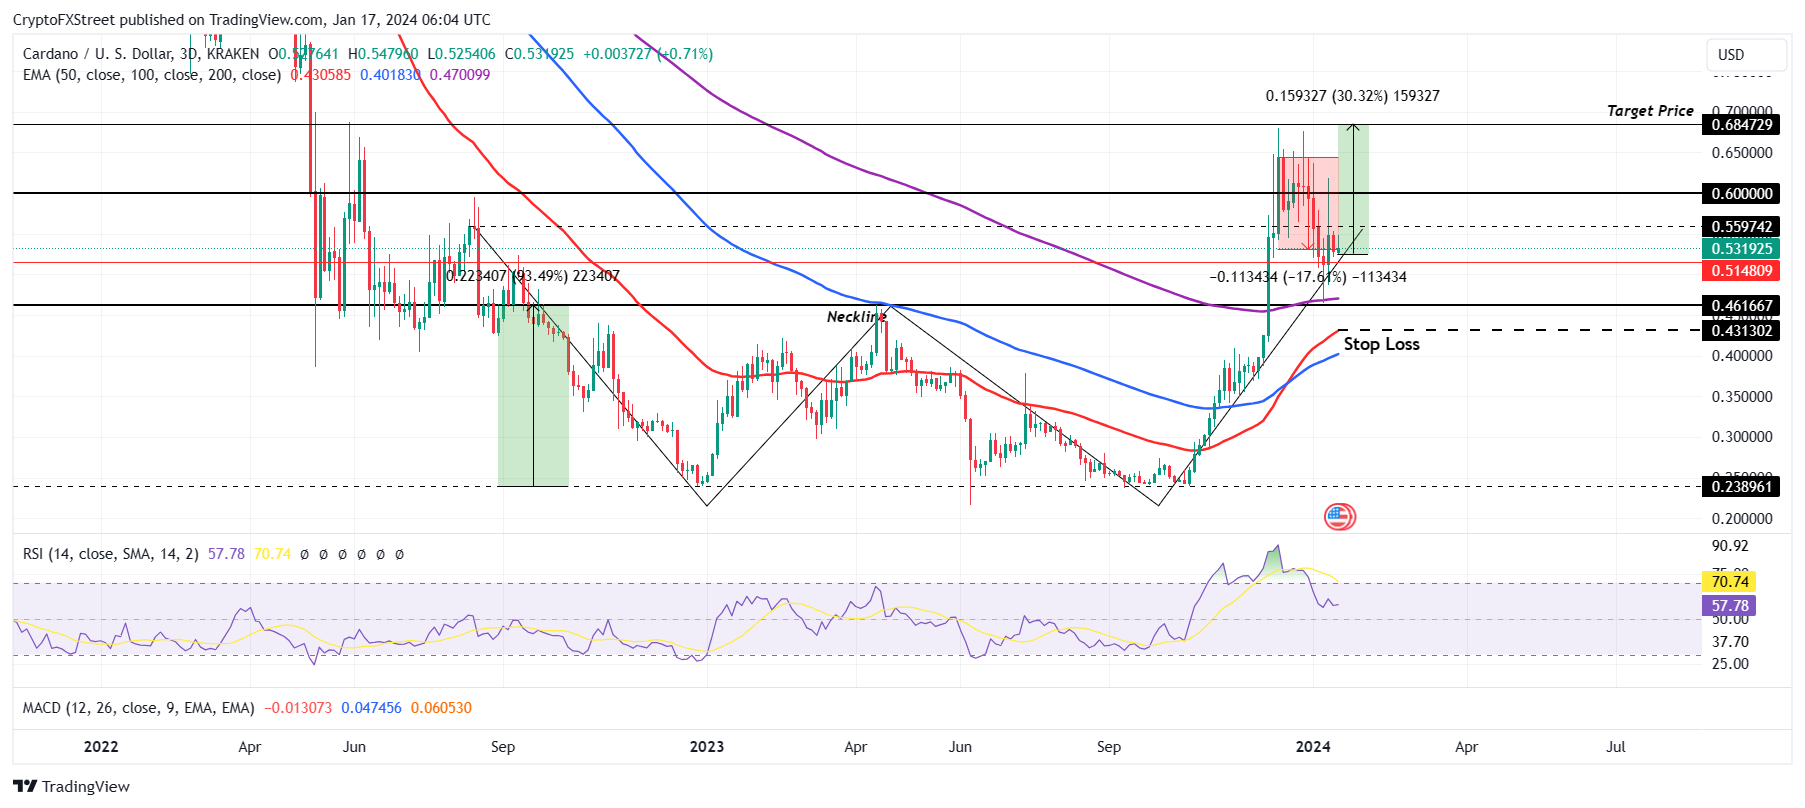
Cardano price nearly confirmed a bullish reversal pattern about four weeks ago but failed to achieve success owing to broader market bearish cues. Although the altcoin is now back at a monthly low, it still has a shot at reclaiming the target price derived from the pattern, which places the likely rally at 30% above the current price, and it looks like the whales might play a crucial role in this rally.
Cardano price sees green
Cardano price trading at $0.53 at the time of writing, is stabilizing itself following a 17.61% decline in the past four weeks. ADA nearly successfully completed a double bottom pattern, also known as a “W” pattern. This bullish reversal pattern suggested a potential 30% rally for the altcoin, which it almost achieved before the decline began.
However, since Cardano price is still far above the stop loss marked at $0.43, it has a shot at reclaiming the target price of $0.68. This price point is marked 30% above the trading price, and as long as ADA manages to bounce back from the $0.51 support, it can reinitiate an attempt at reclaiming the target rally.
ADA/USD 1-day chart
But if the tides turn south and bearish cues dominate the price action, ADA could decline, and a fall below the $0.51 support line could send the altcoin to $0.43, which marks the stop loss. Coinciding with the 50-day Exponential Moving Average (EMA), losing this support could result in an invalidation of the bullish thesis.
Whales could push the altcoin up
Cardano addresses holding between 1 million and 10 million ADA, which are generally whales or large wallet holders, and their actions tend to impact the price action. Their selling induces crashes and accumulation support rallies. In the four weeks, these whale addresses have been accumulating adding 160 million ADA worth $85 million to their wallets.
Despite the aforementioned crash, these ADA holders have kept themselves focused and now hold over 5.79 billion ADA tokens. Furthermore, the Market Value to Realized Value (MVRV) ratio is also signalling potential bullishness.
 [11.41.37, 17 Jan, 2024]-638410757423334399.png)
Cardano whale holdings
The MVRV ratio is used to assess the average profit/loss of investors who purchase an asset, and the 30-day MVRV ratio gives an idea of the profits or losses of investors who purchased an asset in the past month.
At the moment, the indicator is at -10 %, suggesting that the investors who bought ADA in the last 30 days are at a 10% loss. Whenever the MVRV value hits anywhere between -8% and -18%, it is often followed by rallies. The reason behind this is that at this time, ADA is in an ideal place for accumulation, making it an “opportunity zone”.
 [11.29.16, 17 Jan, 2024]-638410757932227328.png)
Cardano MVRV ratio
Thus, if the investors and whales choose to accumulate, they will most likely end up pushing the price up, resulting in the validation of the bullish thesis.
Author

Aaryamann Shrivastava
FXStreet
Aaryamann Shrivastava is a Cryptocurrency journalist and market analyst with over 1,000 articles under his name. Graduated with an Honours in Journalism, he has been part of the crypto industry for more than a year now.


