|

Cardano price could fall to $1.00 before seeing more gains

  • Cardano price sees strong Fibonacci extension support levels at $1.00 and $0.88.
  • ADA price volume is increasing in the bears’ favor.
  • An invalidation for the bullish narrative will be a close at $1.16.

Cardano price action is likely to continue falling into lower Fibonacci targets amidst the current downslide.

Cardano price is in a dangerous correction until further notice

Cardano price action fooled analysts last week as the Ethereum Killer breached the bullish trade setups. ADA price is currently trading at $1.07 and looking more bearish as time passes. A Fibonacci projection indicator points to the $1.00 support for Cardano price at the 161.8% ratio. However, traders should consider waiting for ADA price to establish distinguishable chart patterns in this region before attempting to catch the falling knife.

Cardano price spells for more selloffs on the volume indicator as well. There is an uptick in volume on the 8-hour chart as the bears have breached the 100% Fib extension level. If the bulls cannot find support at the $1.00 zone, the next target will be at the 261.8% Fib extension level at $0.88.
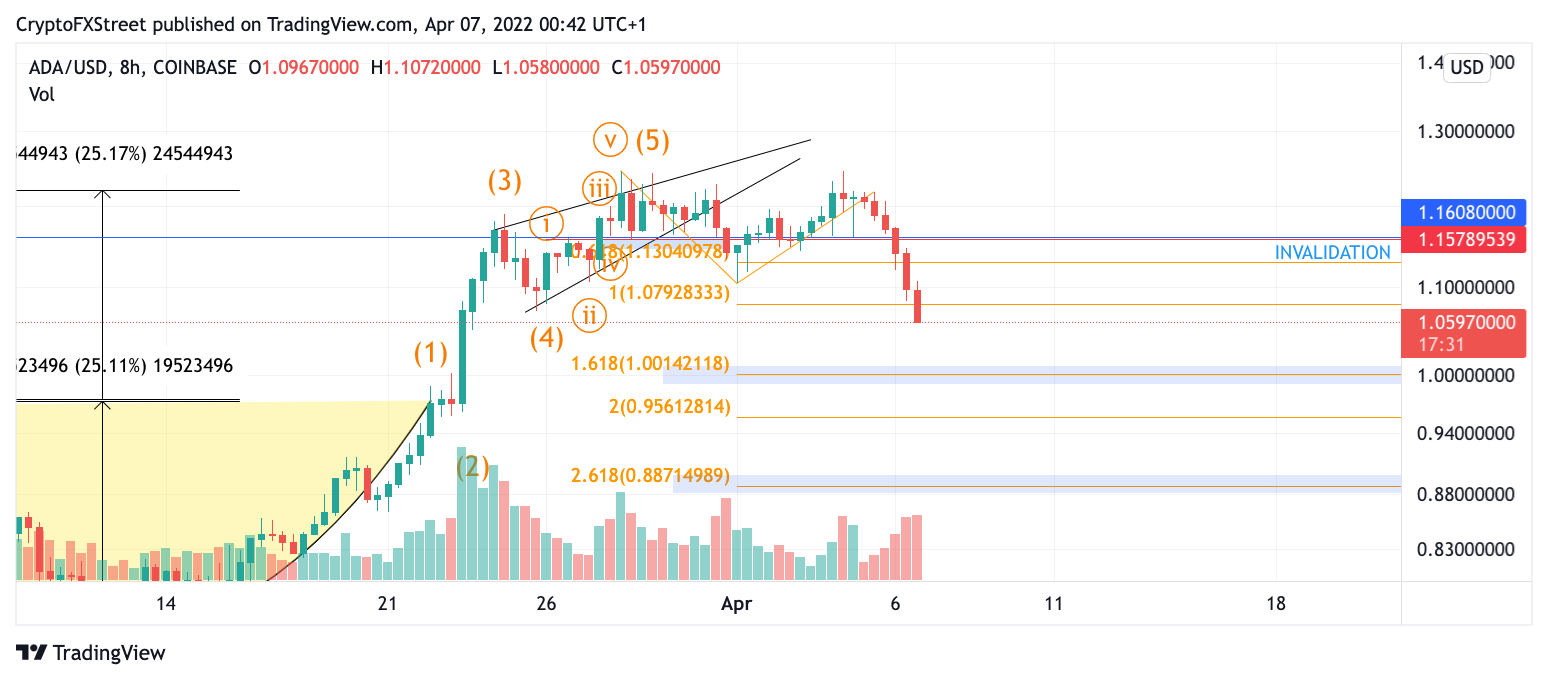
ADA 4/6/22

ADA/USD 8-Hour Chart

Invalidation for the bearish setup is a closing candle above $1.16. If this were to occur, the bulls could then load up and aim for the Cardano price to reach the $1.35 region, resulting in a 27% increase from the current ADA price.


FX Trading Revolution - Your Revolutionary Forex Source

Author

FX Trading Revolution Team

FX Trading Revolution Team

FX Trading Revolution

The FX Trading Revolution website is a free independent FOREX source, and was founded to provide true and unbiased information about FOREX trading.


More from FX Trading Revolution Team
Share:

Editor's Picks

Bitcoin Weekly Forecast: BTC retreats as macro headwinds grow
Bitcoin (BTC) remains under pressure, down over 4% this week and trading around $76,900 at the time of writing on Friday. Institutional demand shows signs of weakness as spot BTC Exchange Traded Funds (ETFs) are on track to end their three-week inflow streak, recording nearly $500 million in net outflows through Thursday.
XRP falls toward key support as macro uncertainty, weak momentum cap recovery
Ripple (XRP) falls below $1.33 on Friday, marking the third consecutive day of declines. The token continues to track the broader cryptocurrency market downturn, with investors closely monitoring heightened macroeconomic uncertainty ahead of the United States (US) Consumer Price Index (CPI) release and next week’s Federal Reserve (Fed) monetary policy decision.
Crypto Today: Bitcoin, Ethereum, XRP stabilize at lower levels amid ETF outflows and macroeconomic risks
The broader cryptocurrency market is rising on Friday, with Bitcoin (BTC) trading above $77,000 after testing lower support near $76,500. Ethereum (ETH) shows signs of stability, hovering above the support provided at $2,400 despite capped upside at $2,500. Meanwhile, Ripple (XRP) holds above $1.33 after three straight days of declines, reflecting growing headwinds due to macroeconomic uncertainty.
Bitcoin pulls back as another golden cross fails to deliver
Earlier this week, Bitcoin formed a golden cross, a technical signal that occurs when the price’s 50-day moving average rises above the 200-day moving average and is conventionally viewed as a precursor to a bullish rally. Historically, however, that’s often not been the case.
Bitcoin: BTC retreats as macro headwinds grow
Bitcoin (BTC) remains under pressure, down over 4% this week and trading around $76,900 at the time of writing on Friday. Institutional demand shows signs of weakness as spot BTC Exchange Traded Funds (ETFs) are on track to end their three-week inflow streak, recording nearly $500 million in net outflows through Thursday.


