Cardano bulls show signs of exhaustion
- Cardano’s price is falling on Tuesday as it faces rejection around $0.624 and traders engaged in profit-taking following the recent rally.
- Technical indicators show signs of weakness in upward momentum as the RSI exits from the overbought territory.
- ADA’s NPL chart shows spikes, suggesting that holders are realizing profits and increasing the selling pressure.

Cardano (ADA) price extends its decline for a second consecutive session on Wednesday, trading down by more than 7% at around $0.53 after rallying over 80% the previous week. The main reason for the decline is that traders are taking profits, while technical indicators suggest further downside is likely.
Why is Cardano going down today?
Cardano price is falling more than 7% on Wednesday after a 6.9% fall on Tuesday. The decline can broadly be attributed to profit-taking activity, on-chain data shows.
Santiment’s Network Realized Profit/Loss (NPL) indicator – a widely used metric to gauge profit-taking activity – posted the strongest spike since mid-March, signaling the highest profit-taking activity in at least eight months following the approximately 80% rally seen last week. The metric rose from 9.58 million on Saturday to 93.96 million on Monday, almost 10 times. Such a spike is increasing the selling pressure on Cardano.
%20[13.07.05,%2013%20Nov,%202024]-638670859806486492.png)
Cardano Network Realized Profit/Loss chart. Source: Santiment
Cardano’s technical outlook shows signs of bullish exhaustion as the Relative Strength Index (RSI) has exited the overbought threshold and trades at 67 on the daily chart, a clear sell signal.
Moreover, ADA faced multiple rejections of around $0.624 this week and has declined more than 12% since Tuesday, adding more credence to its fall.
If Cardano continues to decline, it could extend the correction by an additional 16% to retest its next daily support at $0.448.
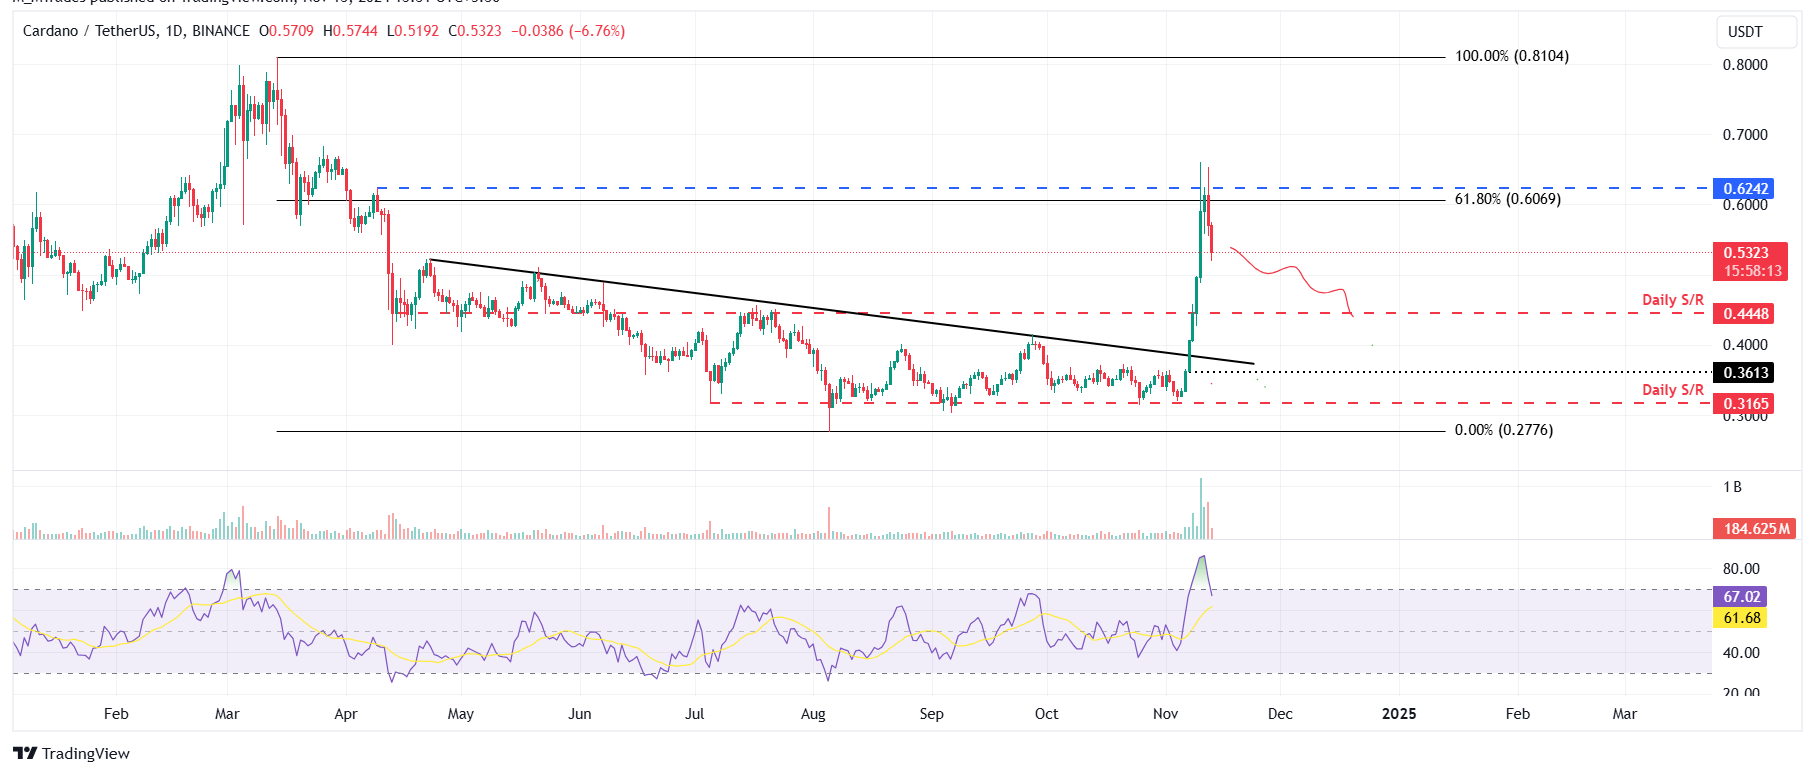
ADA/USDT daily chart
Traders’ price outlook for Cardano turns bearish
Coinglass data shows that ADA’s long-to-short ratio is at 0.84 on Wednesday, the lowest level in one month. A figure below one suggests that more traders are betting on Cardano’s price to fall.
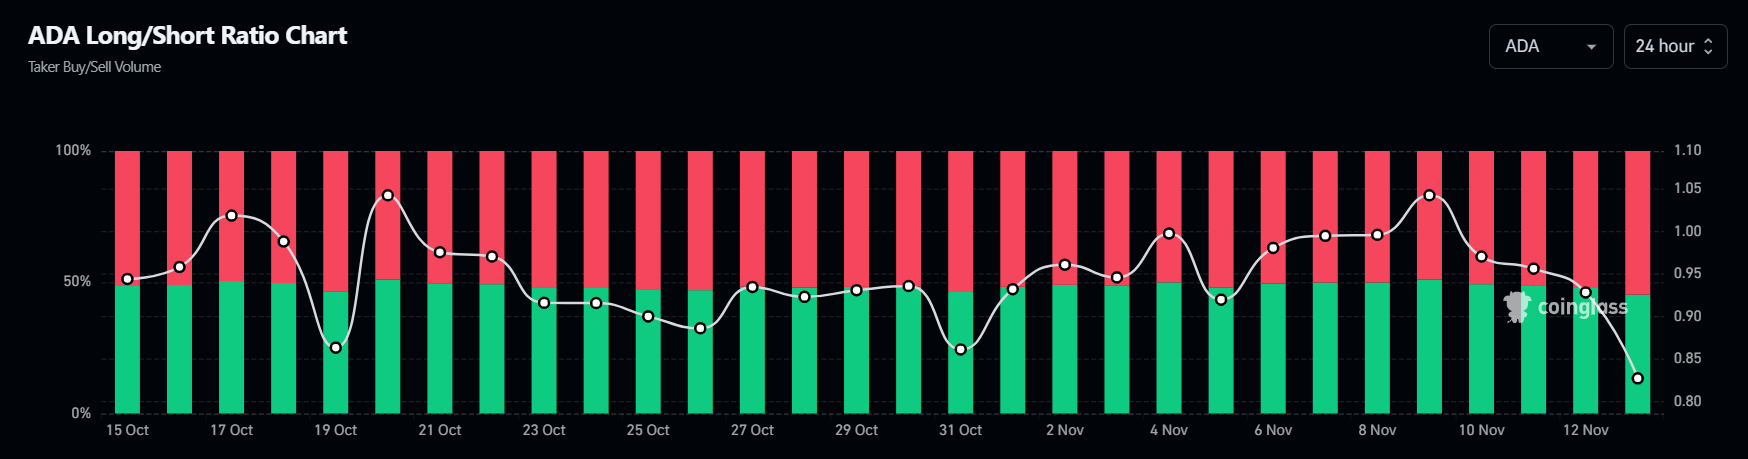
ADA long-to-short ratio chart. Source: Coinglass
Cryptocurrency metrics FAQs
The developer or creator of each cryptocurrency decides on the total number of tokens that can be minted or issued. Only a certain number of these assets can be minted by mining, staking or other mechanisms. This is defined by the algorithm of the underlying blockchain technology. On the other hand, circulating supply can also be decreased via actions such as burning tokens, or mistakenly sending assets to addresses of other incompatible blockchains.
Market capitalization is the result of multiplying the circulating supply of a certain asset by the asset’s current market value.
Trading volume refers to the total number of tokens for a specific asset that has been transacted or exchanged between buyers and sellers within set trading hours, for example, 24 hours. It is used to gauge market sentiment, this metric combines all volumes on centralized exchanges and decentralized exchanges. Increasing trading volume often denotes the demand for a certain asset as more people are buying and selling the cryptocurrency.
Funding rates are a concept designed to encourage traders to take positions and ensure perpetual contract prices match spot markets. It defines a mechanism by exchanges to ensure that future prices and index prices periodic payments regularly converge. When the funding rate is positive, the price of the perpetual contract is higher than the mark price. This means traders who are bullish and have opened long positions pay traders who are in short positions. On the other hand, a negative funding rate means perpetual prices are below the mark price, and hence traders with short positions pay traders who have opened long positions.
Author

Manish Chhetri
FXStreet
Manish Chhetri is a crypto specialist with over four years of experience in the cryptocurrency industry.


