Can Dogecoin bulls maintain control as crypto market bleeds
- Dogecoin price is on the sixth weekly candlestick that has failed to break out of the falling wedge pattern.
- As DOGE retests the $0.109 to $0.124 demand zone, there is a chance to re-establish the directional bias.
- A weekly candlestick close above $0.159 will invalidate the bearish outlook.

Dogecoin price has been in a bullish pattern for roughly a year and is struggling to break out. The attempts to breach this bullish setup have been ongoing for the sixth week. If successful, this moe could trigger explosive gains for early investors, but a failure could catalyze a steep crash.
Dogecoin price delays its move
Dogecoin price action has done nothing but slides lower for the last year as it dropped 85% from its all-time high of $0.740 to where it currently trades - $0.126. Interestingly, this moe south has created three lower highs and lower lows on the weekly time frame.
Connecting these swing points using trend lines describes a falling wedge pattern. This technical formation forecasts a 68% upswing to $0.217, obtained by adding the distance between the first swing high and swing low to the breakout point.
After six failed attempts, DOGE is back to retest the $0.109 to $0.124 weekly demand zone. Considering the bearish outlook of the crypto markets, this downswing could lead to a catastrophic crash if the dog-themed crypto shatters the $0.109 barrier.
Such a move could trigger a 30% pullback to $0.078, where buyers could come to the rescue. This move would invalidate the falling wedge’s bullish thesis. In a dire case, A breakdown of the $0.048 on a weekly time frame could be a pivotal moment.
This step could further trigger a 70% nosedive due to the fair value gap that extends from $.041 to $0.014.
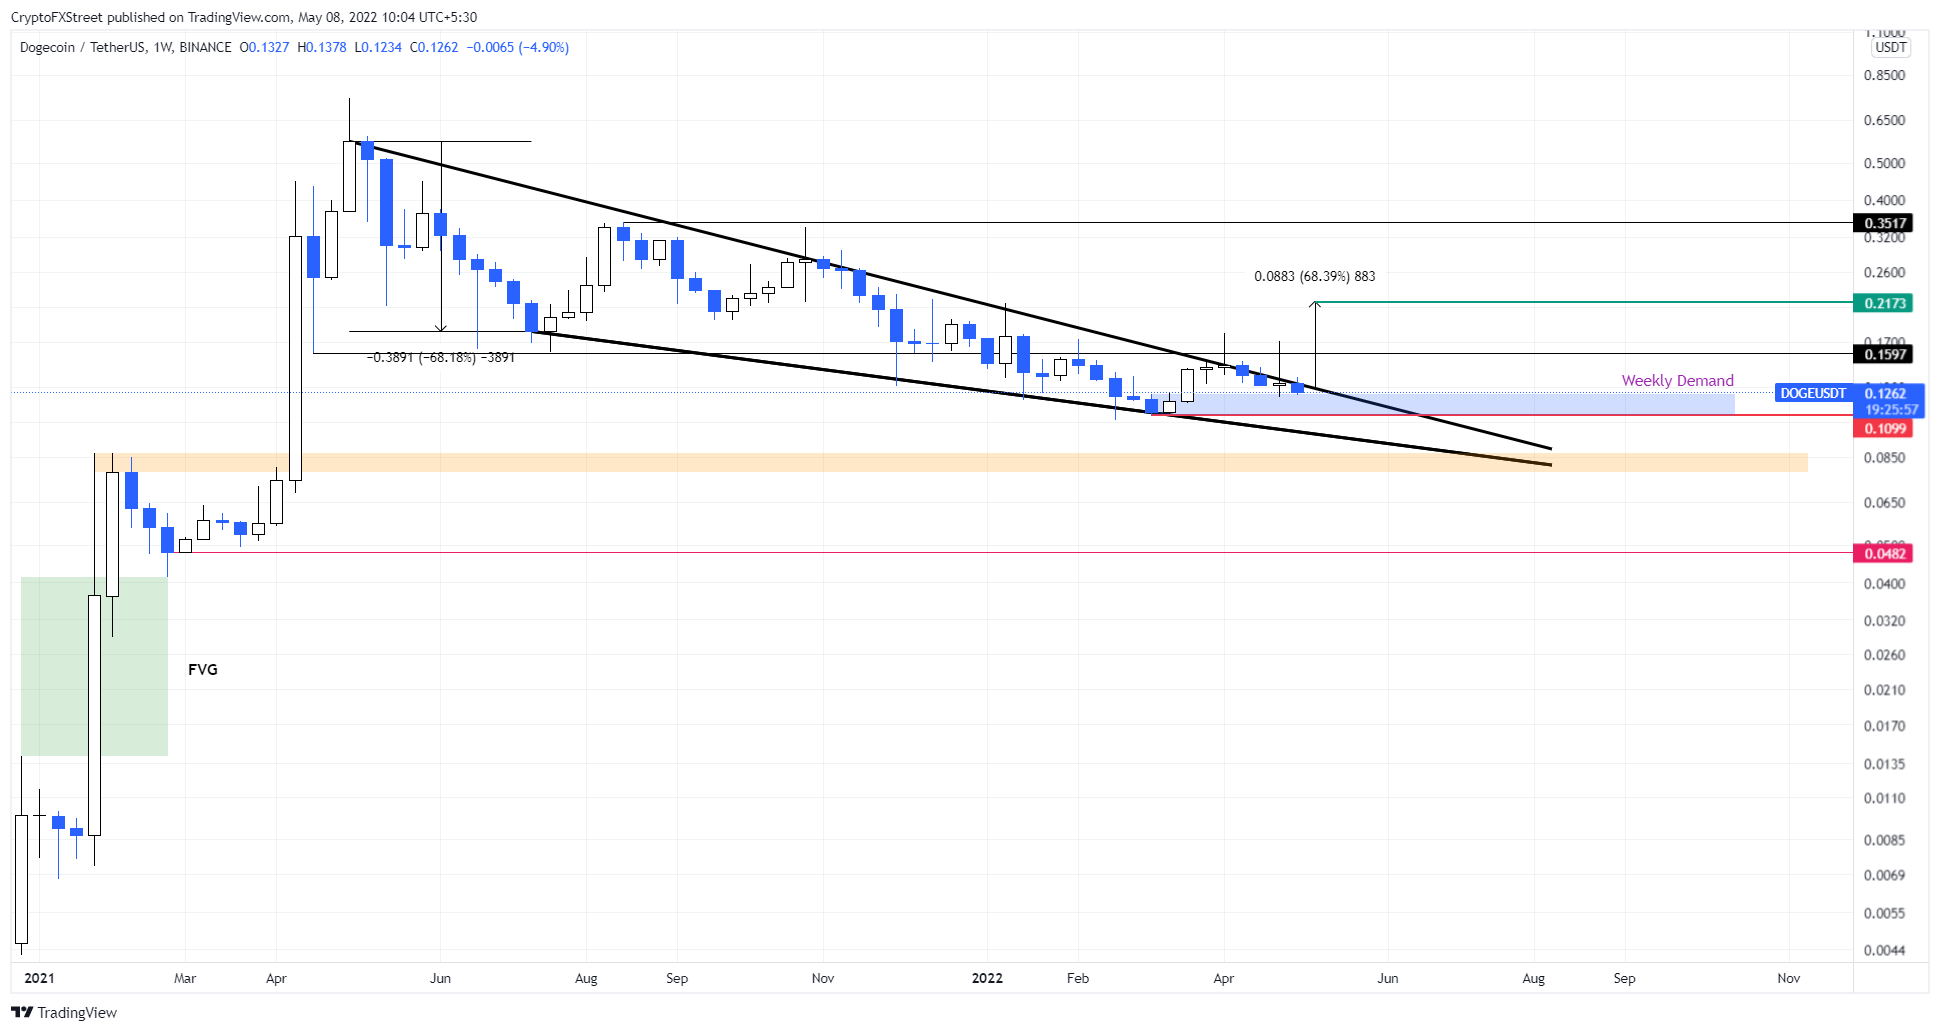
DOGE/USDT 1-week chart
While things are looking on the fence for Dogecoin. a weekly candlestick close above $0.159 confirms a bullish breakout. This development will also invalidate the bearish thesis and trigger a move that retests the $0.217.
Author

Akash Girimath
FXStreet
Akash Girimath is a Mechanical Engineer interested in the chaos of the financial markets. Trying to make sense of this convoluted yet fascinating space, he switched his engineering job to become a crypto reporter and analyst.


