|

BTC/USD technical analysis: OBV indicator shows uptrend volume is wearing thin

  • Bitcoin is struggling for direction today as BTC/USD trades 0.32% lower on the session.
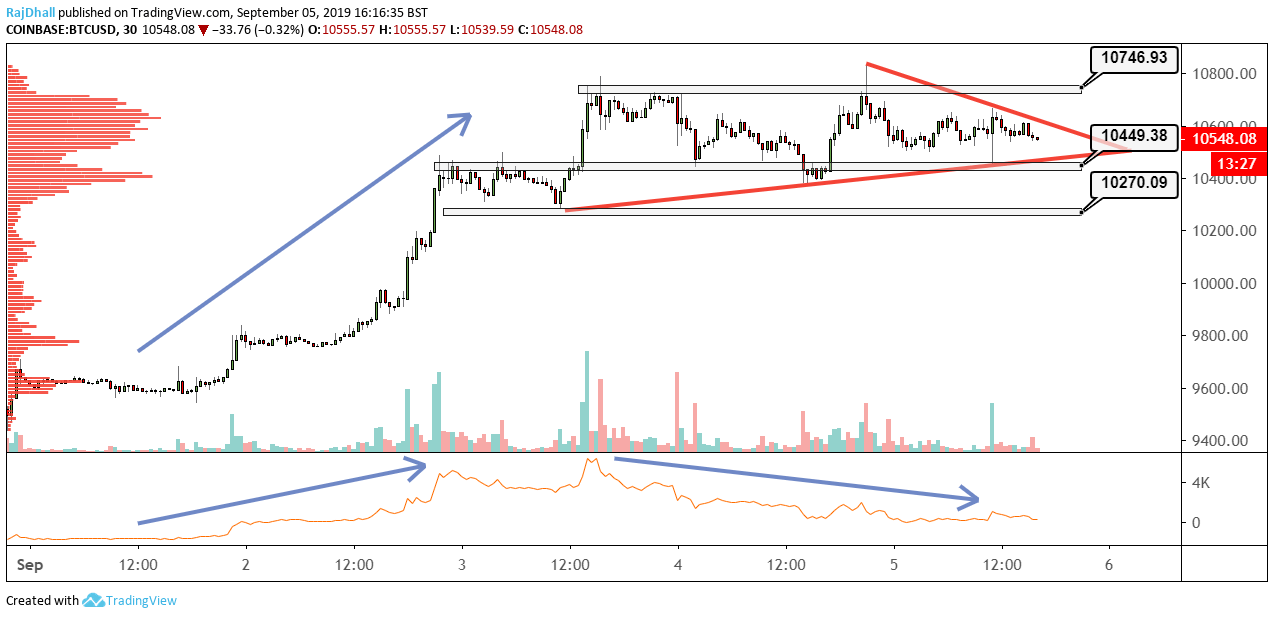
  • The On Balance Volume indicator is shows lower highs while the price rose recently.
Bitcoin Volume Chart

BTC/USD is trading 0.32% lower today after the price/volume looks like its struggling to push the BTC/USD price higher. 

On the 30-minute chart above as the price makes higher highs and then consolidates between 10,400-800 and you can see the On Balance Volume (OBV) indicator move lower.

The OBV indicator is a great tool for measuring the momentum for a move. Traditionally of the indicator keeps moving higher as the uptrend develops you can see the market get behind the move and the trend will continue to rally. 

There are obviously exceptions to the rule when all of a sudden big buying volume comes in but more often than not it does work. 

I find the indicator is very useful when the internals are selling but the price is still moving higher or stable. 

In this case, the indicator will move sharply lower while the price remains relatively stable. 

For confirmation of a loss in momentum I would lookout for a break of the support levels on the chart. The first one is at 10,449 and the stronger one holds at 10,270. If they break then we could see conformation and the bears might be in charge. 

Author

Rajan Dhall, MSTA

Rajan Dhall is an experienced market analyst, who has been trading professionally since 2007 managing various funds producing exceptional returns.

More from Rajan Dhall, MSTA
Share:

Editor's Picks

XRP holds $1.40 amid ETF inflows and stable derivatives market

Ripple trades under pressure, with immediate support at $1.40 holding at the time of writing on Tuesday. A recovery attempt from last week’s sell-off to $1.12 stalled at $1.54 on Friday, leading to limited price action between the current support and the resistance.

Crypto Today: Crypto market holds $2.4 trillion as bearish sentiment persists around Bitcoin, Ethereum, XRP 

The Crypto King, Bitcoin, is constrained below $70,000, with the price holding around $69,000. Altcoins, including Ethereum and Ripple, exhibit technical weakness but are holding above key support levels at $2,000 and $1.40, respectively.

Aster tests resistance as whale activity, perpetuals volume surge

Aster (ASTER) edges higher by over 7% at press time on Thursday, crossing above its 200-period Exponential Moving Average (EMA) on the 4-hour chart while testing a long-term resistance trendline on the daily.

Bitcoin slips below $69,000 as crypto market shows cautious stabilization

Bitcoin price is nearing the lower consolidation boundary, trading below $69,000 at the time of writing on Tuesday. A breakdown below this key level would suggest a correction toward $60,000. However, institutional and corporate demand support a short-term stabilization in BTC.

Bitcoin Price Annual Forecast: BTC holds long-term bullish structure heading into 2026

Bitcoin (BTC) is wrapping up 2025 as one of its most eventful years, defined by unprecedented institutional participation, major regulatory developments, and extreme price volatility.

Bitcoin: The worst may be behind us

Bitcoin (BTC) price recovers slightly, trading at $65,000 at the time of writing on Friday, after reaching a low of $60,000 during the early Asian trading session. The Crypto King remained under pressure so far this week, posting three consecutive weeks of losses exceeding 30%.