BTC/USD Price Analysis: What it might take to crack $50,000
- Bitcoin has started to stall in the weekly rally from the 50% mean reversion of the prior weekly impulse.
- The markets are on the lookout for an extension to the psychological 50,000 level.
- A correction could be in order prior to the next daily extension towards the 50,000 milestones.

The following is a top-down analysis that illustrates where the price action to date across multiple time frames offers a bullish scenario and a potential road map to the 50,000 target.
Weekly chart, Bitcoin
-637485096160205570.png)
From a weekly perspective, the price has rallied from the vicinity of a 50% mean reversion of the prior weekly impulse and could now be expected to extend to a -0.618% of the correction's range at 50,157.60.
Daily chart, Bitcoin
-637485091715049566.png)
However, moving down to the lower time frames, starting with the daily chart, the price has spiked through the resistance that would now be expected to act as support on a correction.
Given the size of the bullish impulse, it is feasible to expect a retracement of sorts.
The price has already struggled to maintain form on the bid and has in fact dropped towards a 38.2% Fibonacci retracement level of the latest daily bullish impulse.
Moving to the lower time frames, it can be illustrated where the next opportunity lies within the market structure and price action.
4-hour chart, Bitcoin
-637485092136318791.png)
As can be seen, the daily 38.2%, as well as the 61.8% Fibonacci retracements, have a confluence with the market structure on the 4-hour chart.
Before the price can extend to the 50,000 landmarks, a more significant correction may need to take place.
The 4-hour impulse has seen the price revert to a 38.2% Fibonacci as a support structure. While above here, there is every chance that the price will continue higher without giving the retracement or a discount to the bulls.
However, on a break of this structure, the 10-moving average will be challenged and corrective prospects to test the support structures and Fibo confluences will be eyed.
Daily Fibonacci targets
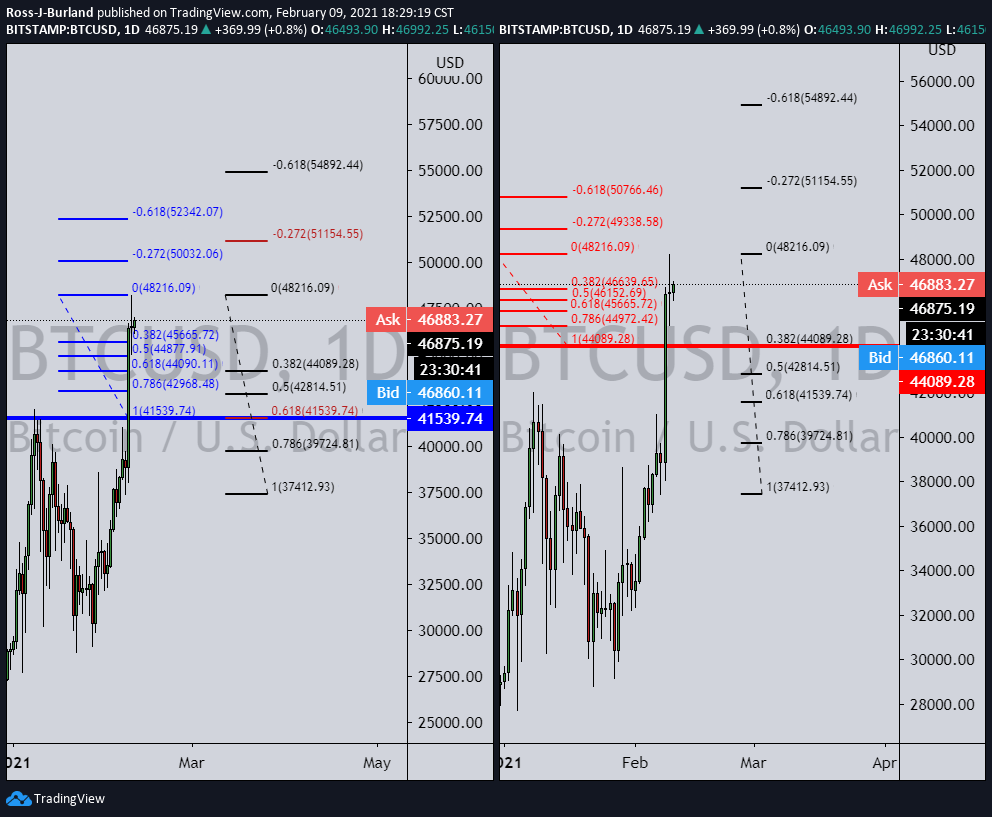
A move to the 8th Feb highs 44,407 meets the daily 38.2% at 44,089.28 and this could be the first critical level of support. (A subsequent hold and rally from there will have the prospects of a 50,766.46 target in a -0.618% Fibo of that correction).
The 8th Feb highs will guard a run back to test the 6th Feb highs of 41,025. This level has a confluence of the daily 61.8% Fibo at 41,539.74. (A subsequent hold and rally from there will have the prospects of a 50,032.06 -0.272% Fibonacci target measured on that correction's range).
Author

Ross J Burland
FXStreet
Ross J Burland, born in England, UK, is a sportsman at heart. He played Rugby and Judo for his county, Kent and the South East of England Rugby team.