![]() Elliott Wave Forecast Team
Elliott Wave Forecast Team
ElliottWave-Forecast.com
Last analysis on the 17th of June expected explosive upwards movement to then be followed by a sharp reversal, which is exactly what has happened for Bitcoin.
Summary: A deep pullback is now expected to end at the 0.618 Fibonacci ratio, at 7,240. But Bitcoin's price history suggests it may be deeper, so more likely somewhere between 7,006 to 3,809. The pullback may end in about 17 weeks.
At its end, this deep pullback may offer a good buying opportunity for Bitcoin.
This will be the last publicly available Bitcoin analysis for a while. While looking for a buying opportunity, Elliott Wave Gold and Elliott Wave Stock Market members will be given preference.
The data used for this analysis comes from Yahoo Finance BTC-USD.
All charts are on a semi-log scale.
MAIN ELLIOTT WAVE COUNT
MONTHLY
The degree of labelling within this analysis is today moved down one degree. This makes no difference to targets, invalidation points or expectations of direction for price. 6/28/19, 6:56 AM
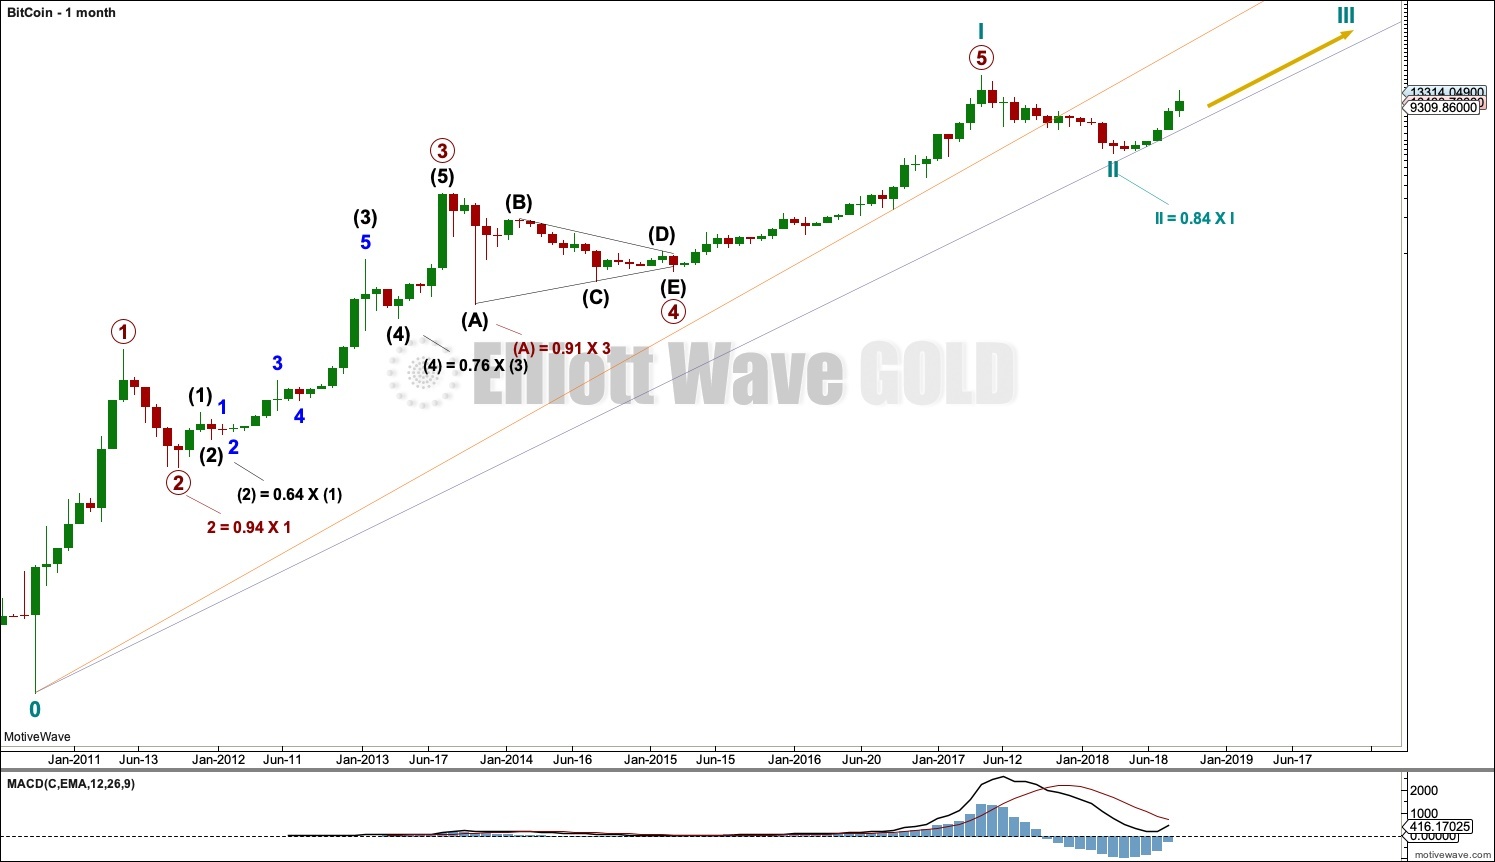
It is possible to see a completed five wave impulse upwards for Bitcoin.
I am unable to find reasonable Fibonacci ratios within this wave count. It appears that Bitcoin may not exhibit Fibonacci ratios very often between its waves, so this makes target calculation impossible. Classic technical analysis was used to identify a high in place on December 23, 2017.
What is very clear from this chart is that Bitcoin forms classic bubbles. It has done so now several times and may now be doing so again. This looks like an even larger bubble than the Tulip Mania. So far each bubble has popped and Bitcoin has collapsed, to then thereafter form a new bubble. Each bubble is larger than the one prior; so if another Bitcoin bubble is forming, it may be expected to take price substantially above the all time high.
Bitcoin tends to behave like an extreme commodity: price moves upwards for about 2 – 4 weeks in a near vertical movement at the end of its rises. Following this vertical movement the resulting downwards movement is very deep (in percentage terms) and often very quick.
The next rise begins slowly with basing action over weeks or months, and then as the rise nears its end another vertical movement completes it. Also, there are volume spikes just before or at the end, which is another feature typical of commodity like behaviour.
This has happened now several times. The most notable instances are the rise up to the week ending 24th November, 2013, and the week ending 5th June, 2011. The following sharp drops were 94% and 93% respectively.
The last instance was the rise up to the last all time high for Bitcoin at 19,870.62 on the 17th of December 2017. The drop thereafter may now be considered as highly likely to be complete. If the drop is complete, it was only an 84% drop.
WEEKLY
Cycle wave II may be a complete zigzag.
Cycle wave III must move above the end of cycle wave I at 19,870.62. It must move far enough above this point to allow room for cycle wave IV to unfold and remain above cycle wave I price territory.
Cycle wave I lasted 7.2 years and cycle wave II may have been over within just under one year. It would be reasonable to expect cycle wave III to last about 7 years, possibly a Fibonacci 8 or 13 years.
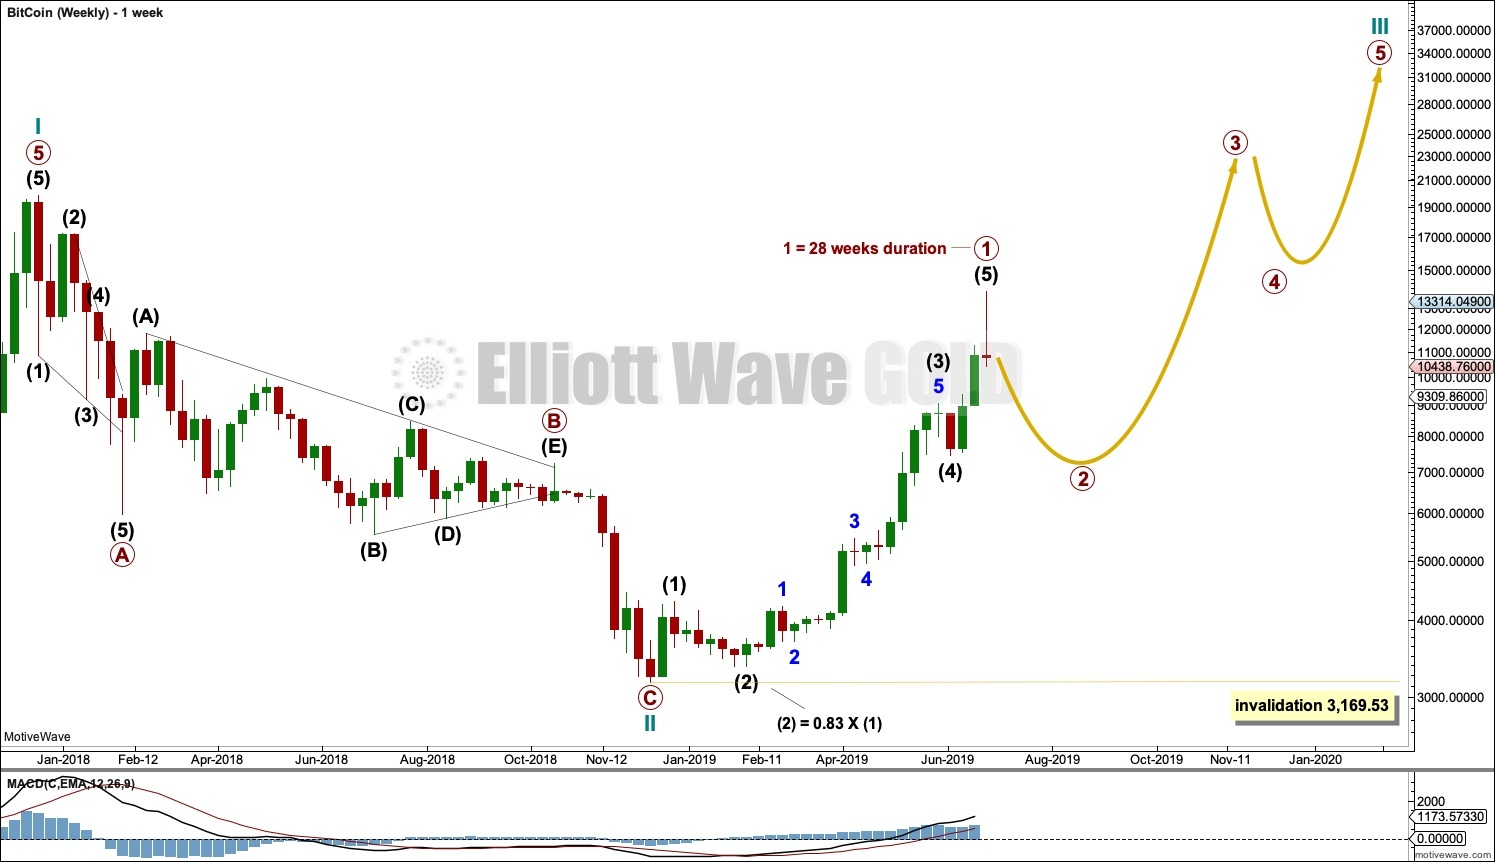
Cycle wave III must unfold as a simple five wave impulse, and within this impulse there should be two large corrections for primary waves 2 and 4. So far primary wave 1 may be complete. Primary wave 2 may now unfold as a three wave structure downwards to possibly last about 17 weeks in duration if it is 0.618 the duration of primary wave 1.
The range of corrections for intermediate, primary and cycle degree corrections for Bitcoin is from 0.64 to 0.94. This gives a potential range for the low of primary wave 2 from 7,006 to 3,809.
DAILY
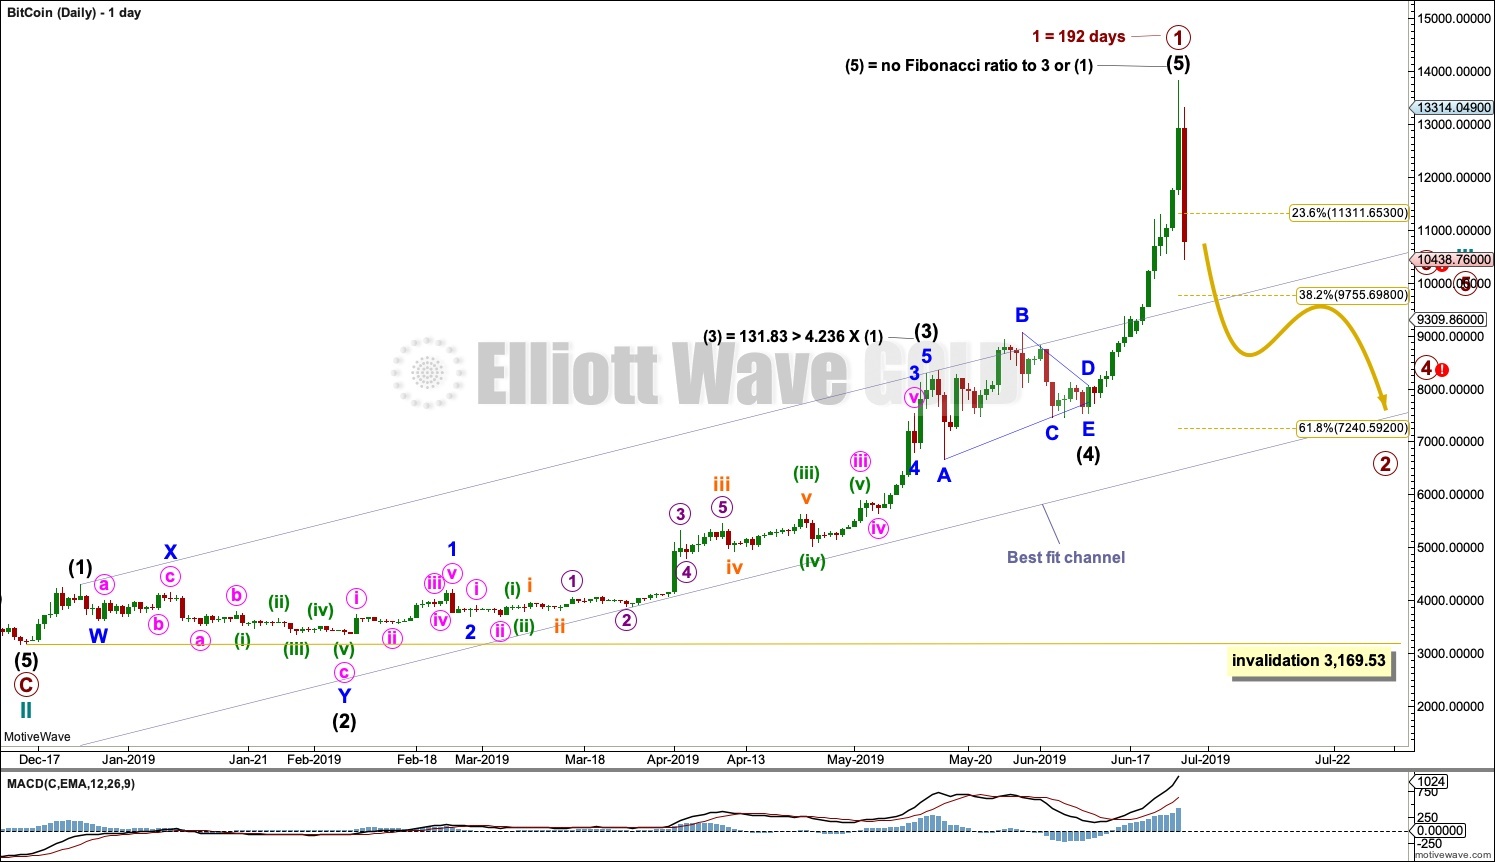
Bitcoin typically forms curved first wave impulses with time consuming and deep second wave corrections, then accelerates through to the end of its third waves, has brief and more shallow fourth wave corrections, and then finishes with explosive fifth waves. This is an extreme behaviour most typically seen in commodities.
This pattern has again been repeated and is seen clearly on an arithmetic chart for primary wave 1.
Intermediate wave (2) was deep and time consuming. It was 0.83 the length of intermediate wave (1) and lasted 44 days. The slope of the wave increases as momentum increases up to the end of intermediate wave (3), and then intermediate wave (4) is more shallow at 0.15 the length of intermediate wave (3) (at its terminus, the deepest portion for minor wave A was 0.33 of intermediate wave (3), which is still shallow) and lasted 27 days.
Thereafter, momentum and the slope shows a further increase to end in near vertical movement. This has now been followed by a very sharp decline.
Primary wave 2 may be expected to most likely subdivide as a zigzag. It may last about 17 weeks if it is 0.618 the duration of primary wave 2, and it may be a very deep correction. Focus of this analysis will now be on identifying the end of primary wave 2 as a potential buying opportunity.
After last analysis, the alternate wave count was discarded based upon a very low probability. To see the logic behind this decision please refer to last analysis here.
TECHNICAL ANALYSIS
WEEKLY
The following characteristics can be noted at the end of prior major highs for Bitcoin:
The first sharp rise to the week beginning 5th June 2011: near vertical movement for several weeks, a sharp volume spike for a blow off top on the final week, and no candlestick reversal pattern on the weekly chart but an Evening Doji Star on the daily chart. The following correction was 0.94.
The next sharp rise to the week beginning 7th April 2013: near vertical movement for three weeks, a sharp volume spike on the final week that closed red and formed a Bearish Engulfing pattern on the weekly chart, a Bearish Engulfing pattern on the daily chart, ADX remained very extreme for most of the rise, and single week bearish divergence between price and RSI at the end. The following correction was 0.82.
The next sharp rise to the week beginning 24th November 2013: vertical movement for four weeks, a strong rise in volume until the last week (which saw volume fall), a Bearish Engulfing pattern on the weekly chart, an 6/28/19, 6:56 AM
Evening Doji Star on the daily chart (the third candlestick of which had strong support from volume), ADX reached very extreme for many days, and RSI reached extreme overbought and there exhibited single bearish divergence. The following correction was 0.93.
The last sharp rise to the all time high at 19,870.62 on the 17th of December 2018: vertical movement for three weeks, a strong increase in volume up to the last week (which saw a fall in volume), a Bearish Engulfing pattern on the weekly chart that had support from volume; on the daily chart, ADX reached very extreme for a coupe of weeks or so, RSI reached overbought and there exhibited single bearish divergence, and early downwards movement from the high had support from volume. The following correction was 0.84.
Some conclusions may be drawn about how to identify a major high in Bitcoin:
-
Look for vertical movement on the weekly chart for at least two weeks, and possibly up to several (although when it is more than three the movement may be interspaced with a small pause).
-
Look for either a sharp volume spike for a blow off top, or a strong increase in volume then followed by a single week of lighter volume at the possible high.
-
A bearish candlestick reversal pattern has been seen so far at every major high for Bitcoin, so an absence of any candlestick reversal pattern at a potential high should be viewed very suspiciously.
-
ADX is of no use as it may remain very extreme for long periods of time.
-
RSI may also remain very extreme for long periods of time and may not exhibit any divergence, but it may add a little confidence in the high if it does exhibit bearish divergence in conjunction with other indicators being bearish.
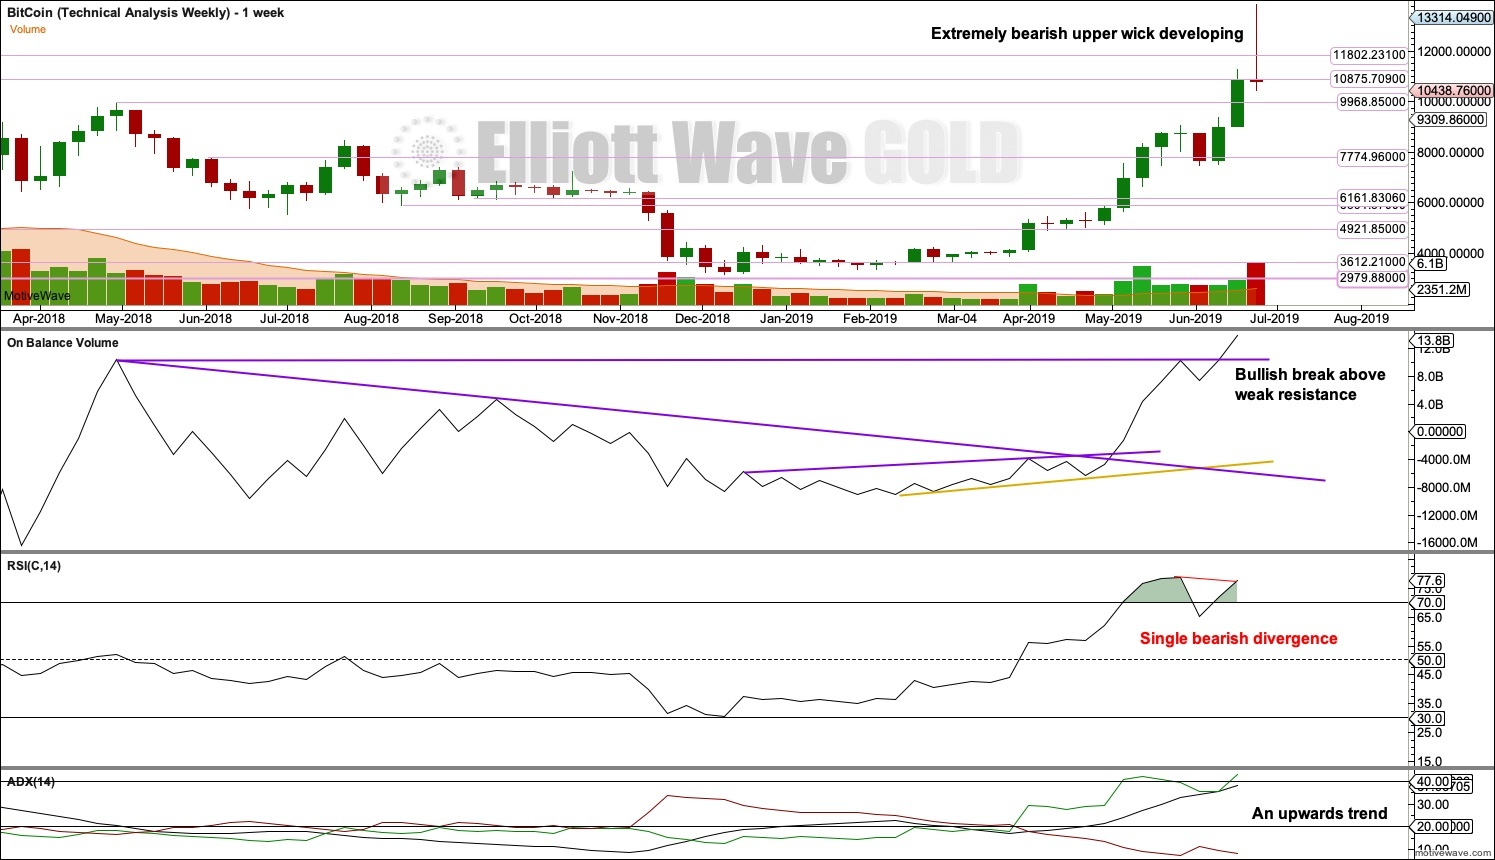
The last vertical rise now exhibits enough of the points looked for to have some confidence that Bitcoin may have found an interim top: vertical movement for three weeks, a volume spike on the last week, and a bearish candlestick reversal pattern that may be developing (although this week still has the Friday to Sunday sessions to complete).
DAILY
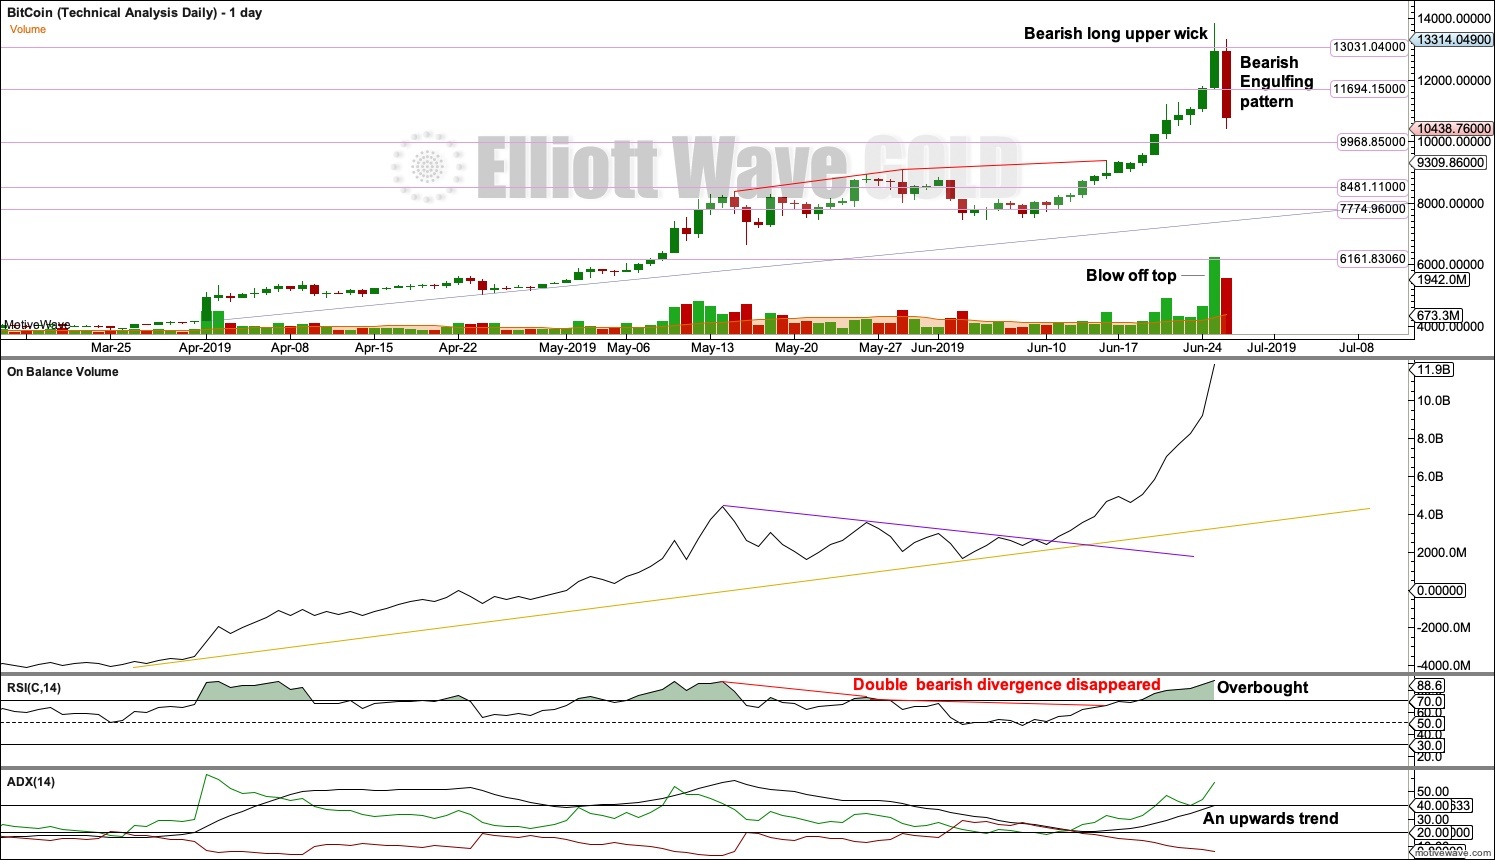
It was noted in last analysis that bearish divergence between price and RSI can simply disappear, and this is what happened in mid June.
Vertical price movement has ended with a sharp volume spike on the daily chart. There is now a very strong bearish candlestick reversal pattern complete at the daily chart level.
Support levels are noted as possible lows for the next expected deep pullback.
Interested in active FX or CRYPTO Elliott Wave labeled charts on a daily basis? Now it's your time; we have a SPECIAL offer; 50% Off on FX and Crypto markets. Check Elliott Wave Forecast website for more details.
FURTHER DISCLOSURES AND DISCLAIMER CONCERNING RISK, RESPONSIBILITY AND LIABILITY Trading in the Foreign Exchange market is a challenging opportunity where above average returns are available for educated and experienced investors who are willing to take above average risk. However, before deciding to participate in Foreign Exchange (FX) trading, you should carefully consider your investment objectives, level of xperience and risk appetite. Do not invest or trade capital you cannot afford to lose. EME PROCESSING AND CONSULTING, LLC, THEIR REPRESENTATIVES, AND ANYONE WORKING FOR OR WITHIN WWW.ELLIOTTWAVE- FORECAST.COM is not responsible for any loss from any form of distributed advice, signal, analysis, or content. Again, we fully DISCLOSE to the Subscriber base that the Service as a whole, the individual Parties, Representatives, or owners shall not be liable to any and all Subscribers for any losses or damages as a result of any action taken by the Subscriber from any trade idea or signal posted on the website(s) distributed through any form of social-media, email, the website, and/or any other electronic, written, verbal, or future form of communication . All analysis, trading signals, trading recommendations, all charts, communicated interpretations of the wave counts, and all content from any media form produced by www.Elliottwave-forecast.com and/or the Representatives are solely the opinions and best efforts of the respective author(s). In general Forex instruments are highly leveraged, and traders can lose some or all of their initial margin funds. All content provided by www.Elliottwave-forecast.com is expressed in good faith and is intended to help Subscribers succeed in the marketplace, but it is never guaranteed. There is no “holy grail” to trading or forecasting the market and we are wrong sometimes like everyone else. Please understand and accept the risk involved when making any trading and/or investment decision. UNDERSTAND that all the content we provide is protected through copyright of EME PROCESSING AND CONSULTING, LLC. It is illegal to disseminate in any form of communication any part or all of our proprietary information without specific authorization. UNDERSTAND that you also agree to not allow persons that are not PAID SUBSCRIBERS to view any of the content not released publicly. IF YOU ARE FOUND TO BE IN VIOLATION OF THESE RESTRICTIONS you or your firm (as the Subscriber) will be charged fully with no discount for one year subscription to our Premium Plus Plan at $1,799.88 for EACH person or firm who received any of our content illegally through the respected intermediary’s (Subscriber in violation of terms) channel(s) of communication.
Recommended Content
Editors’ Picks
TRON gains 10% in 2024, supply of stablecoins reaches over $50 billion in Q1

TRON, a blockchain-based digital platform, has seen positive growth in the first quarter of 2024, as seen in a Messari report. TRON noted gains across several metrics like market capitalization, revenue and total value locked.
XRP hovers near $0.50 as Ripple CTO addresses concerns related to stablecoin launch

XRP is hovering near $0.53 on Friday, spending nearly all week below $0.55. Ripple CTO David Schwartz addressed concerns on stablecoin and XRP utility on Thursday.
Terraform Labs set to restrict access for users in the US after recent ruling in SEC lawsuit

Blockchain company Terraform Labs said Thursday that it will restrict access to some of its products and services for US-based users as it expects to receive a court order soon in light of its legal battle against the US Securities and Exchange Commission (SEC).
Bitcoin Weekly Forecast: BTC’s next breakout could propel it to $80,000 Premium

Bitcoin’s (BTC) recent price consolidation could be nearing its end as technical indicators and on-chain metrics suggest a potential upward breakout. However, this move would not be straightforward and could punish impatient investors.
Bitcoin: BTC’s next breakout could propel it to $80,000 Premium
Bitcoin’s (BTC) recent price consolidation could be nearing its end as technical indicators and on-chain metrics suggest a potential upward breakout. However, this move would not be straightforward and could punish impatient investors.