Bitcoin Weekly Forecast: What to expect from BTC after overcoming $30,000
- Bitcoin price put up a strong front after the US CPI came in lower than expected.
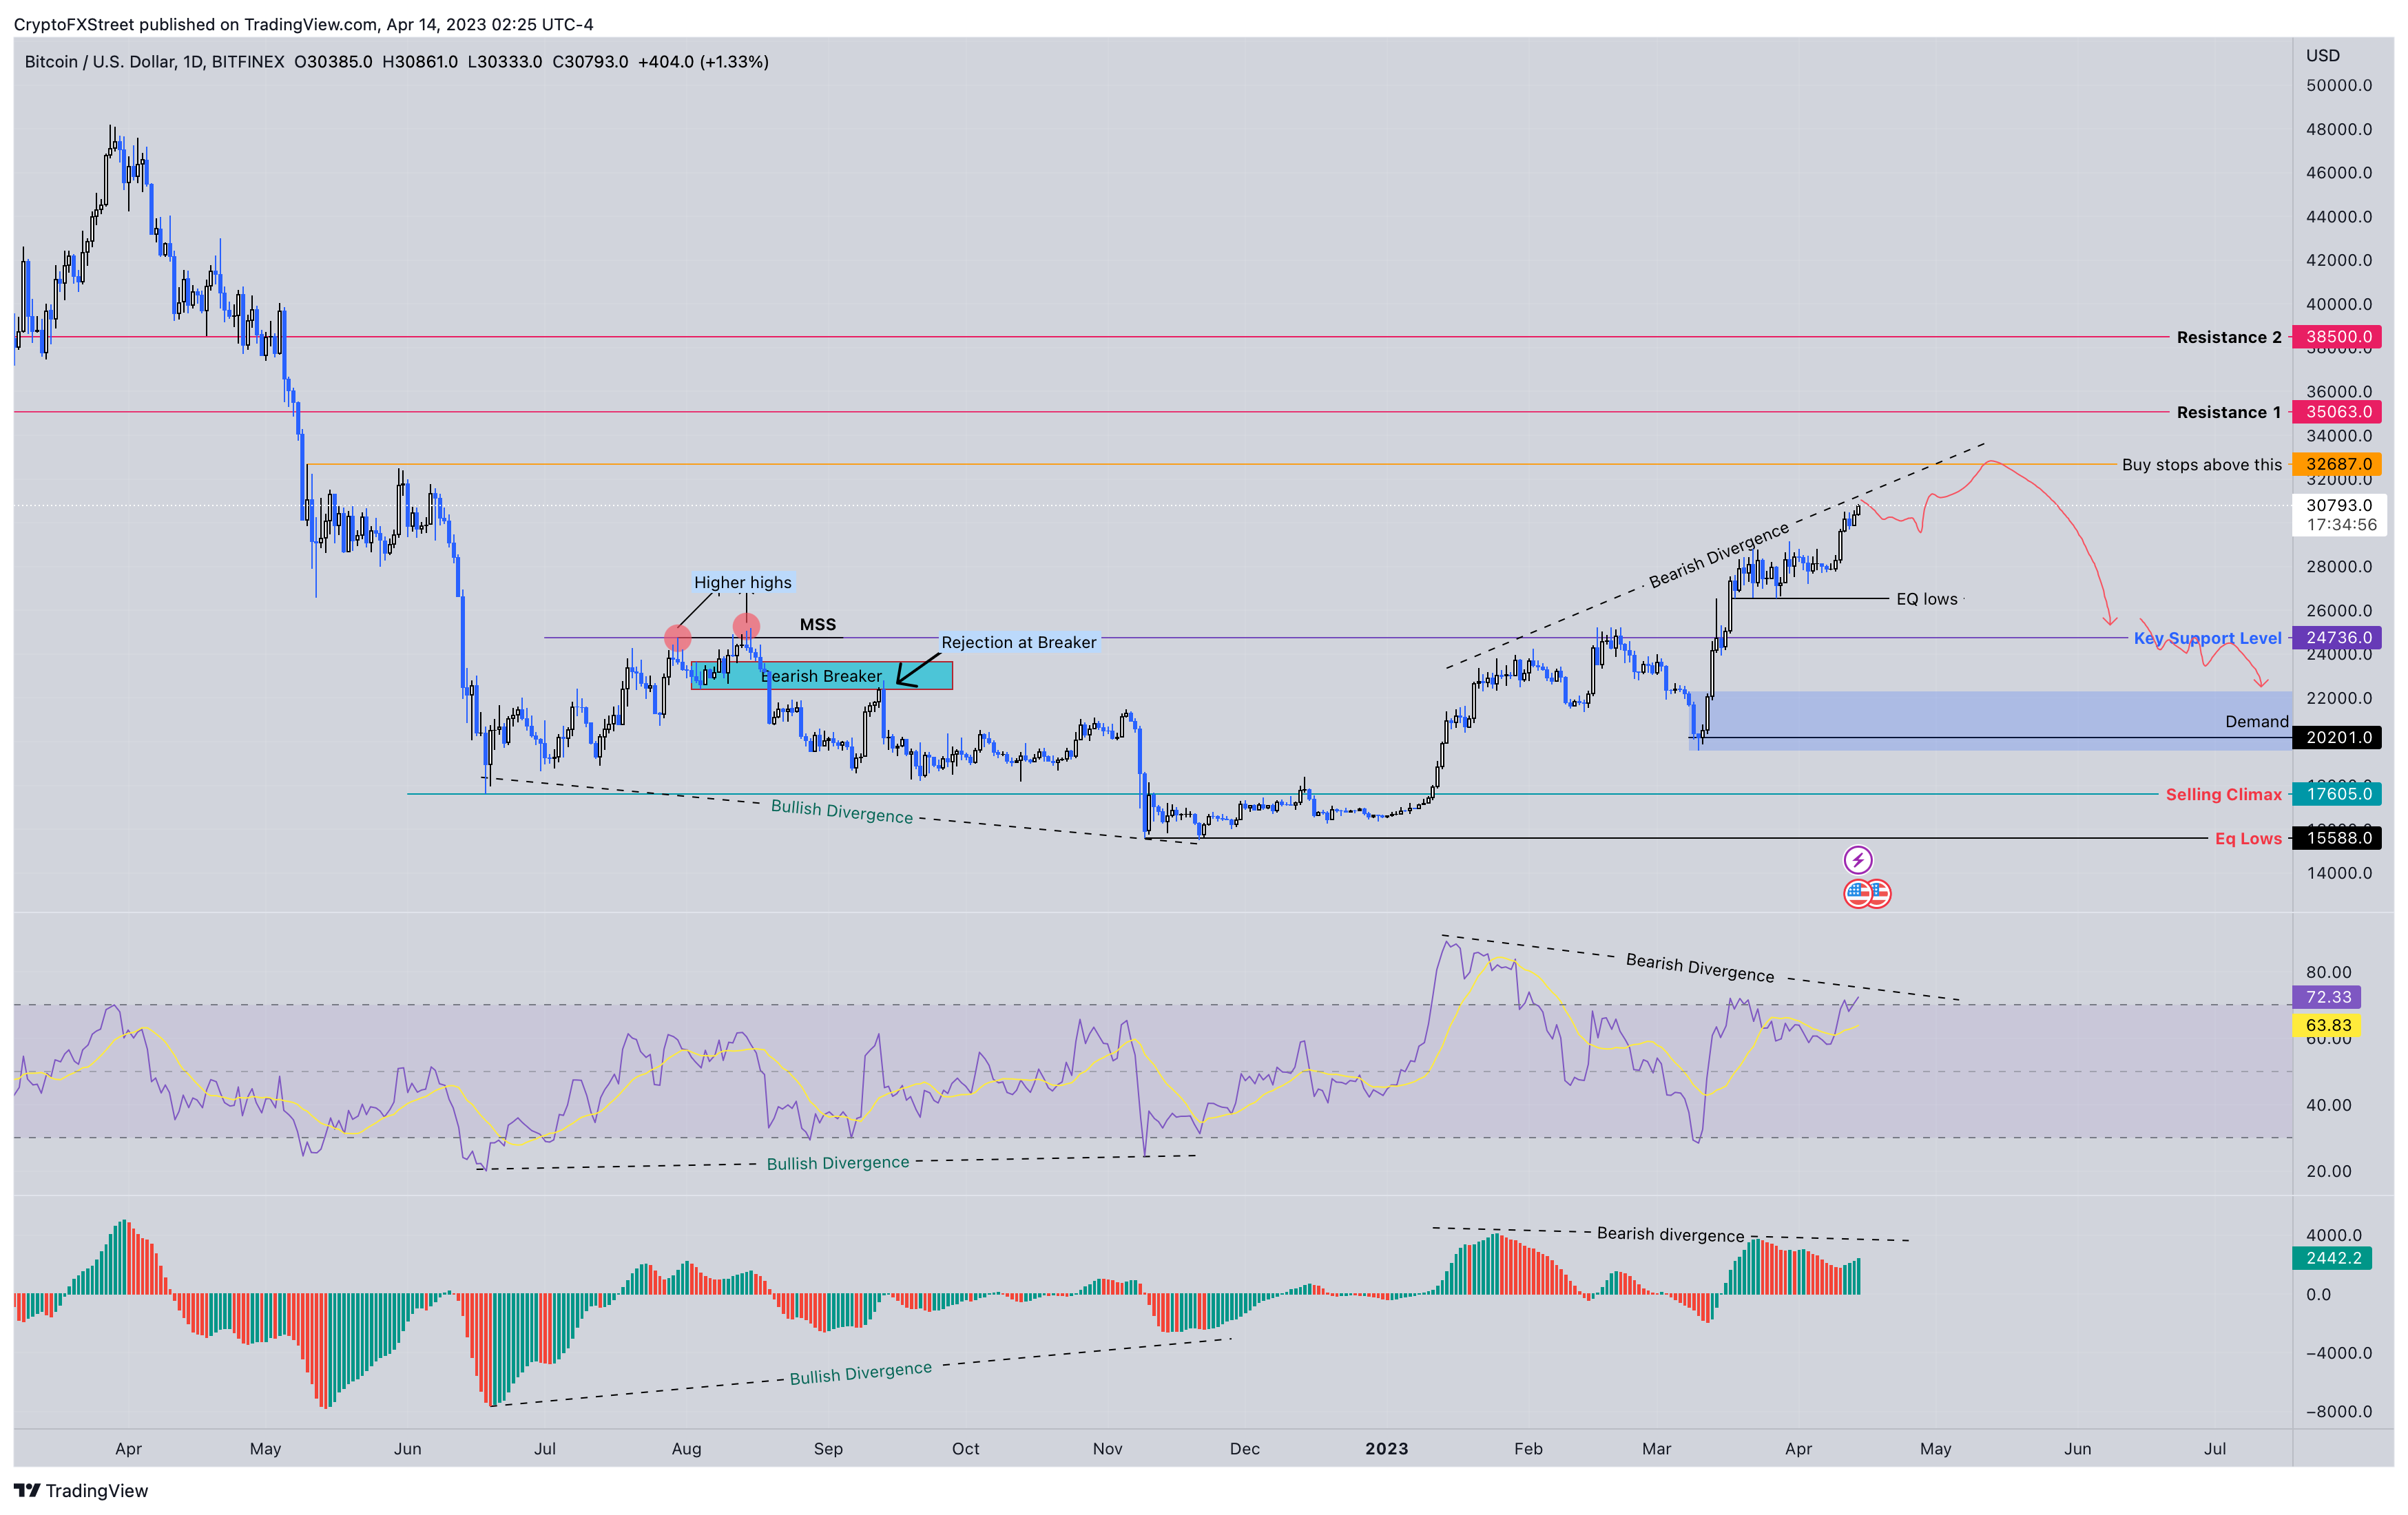
- This development has instilled confidence in investors allowing BTC to aim to retest the following hurdles - $32,687, $35,063 and $38,500.
- If momentum continues to decline while BTC climbs higher, Investors can expect a retracement that catches them off guard.

Bitcoin (BTC) price has shown no signs of slowing down as it continues to climb higher at a steady pace after the recent US Consumer Price Index (CPI) noted a decline from 6% to 5%. This outlook caused BTC to spike higher in the short term but noted a continued uptick in the next few days.
Also read: Bitcoin price explodes past $30,500, gains strength with US CPI release
Bitcoin price defies odds and climbs higher
Bitcoin price continued its ‘consolidate and rally higher’ after the US CPI results came out on April 12. After a brief period of rangebound movement below $30,000, BTC has climbed higher and is currently eyeing the $32,687 hurdle and the buy-stop liquidity resting above it.
Collecting this liquidity and flipping it into a support floor will allow Bitcoin price to go beyond and tag two more critical hurdles at $35,063 and $38,500.
BTC/USDT 1-day chart
Looking at the daily Bitcoin price chart from Chicago Mercantile Exchange (CME) below reveals a gap, extending from $34,445 to $35,180. This area roughly coincides with the $35,063 hurdle mentioned above, making it a good level for buyers to book profits.
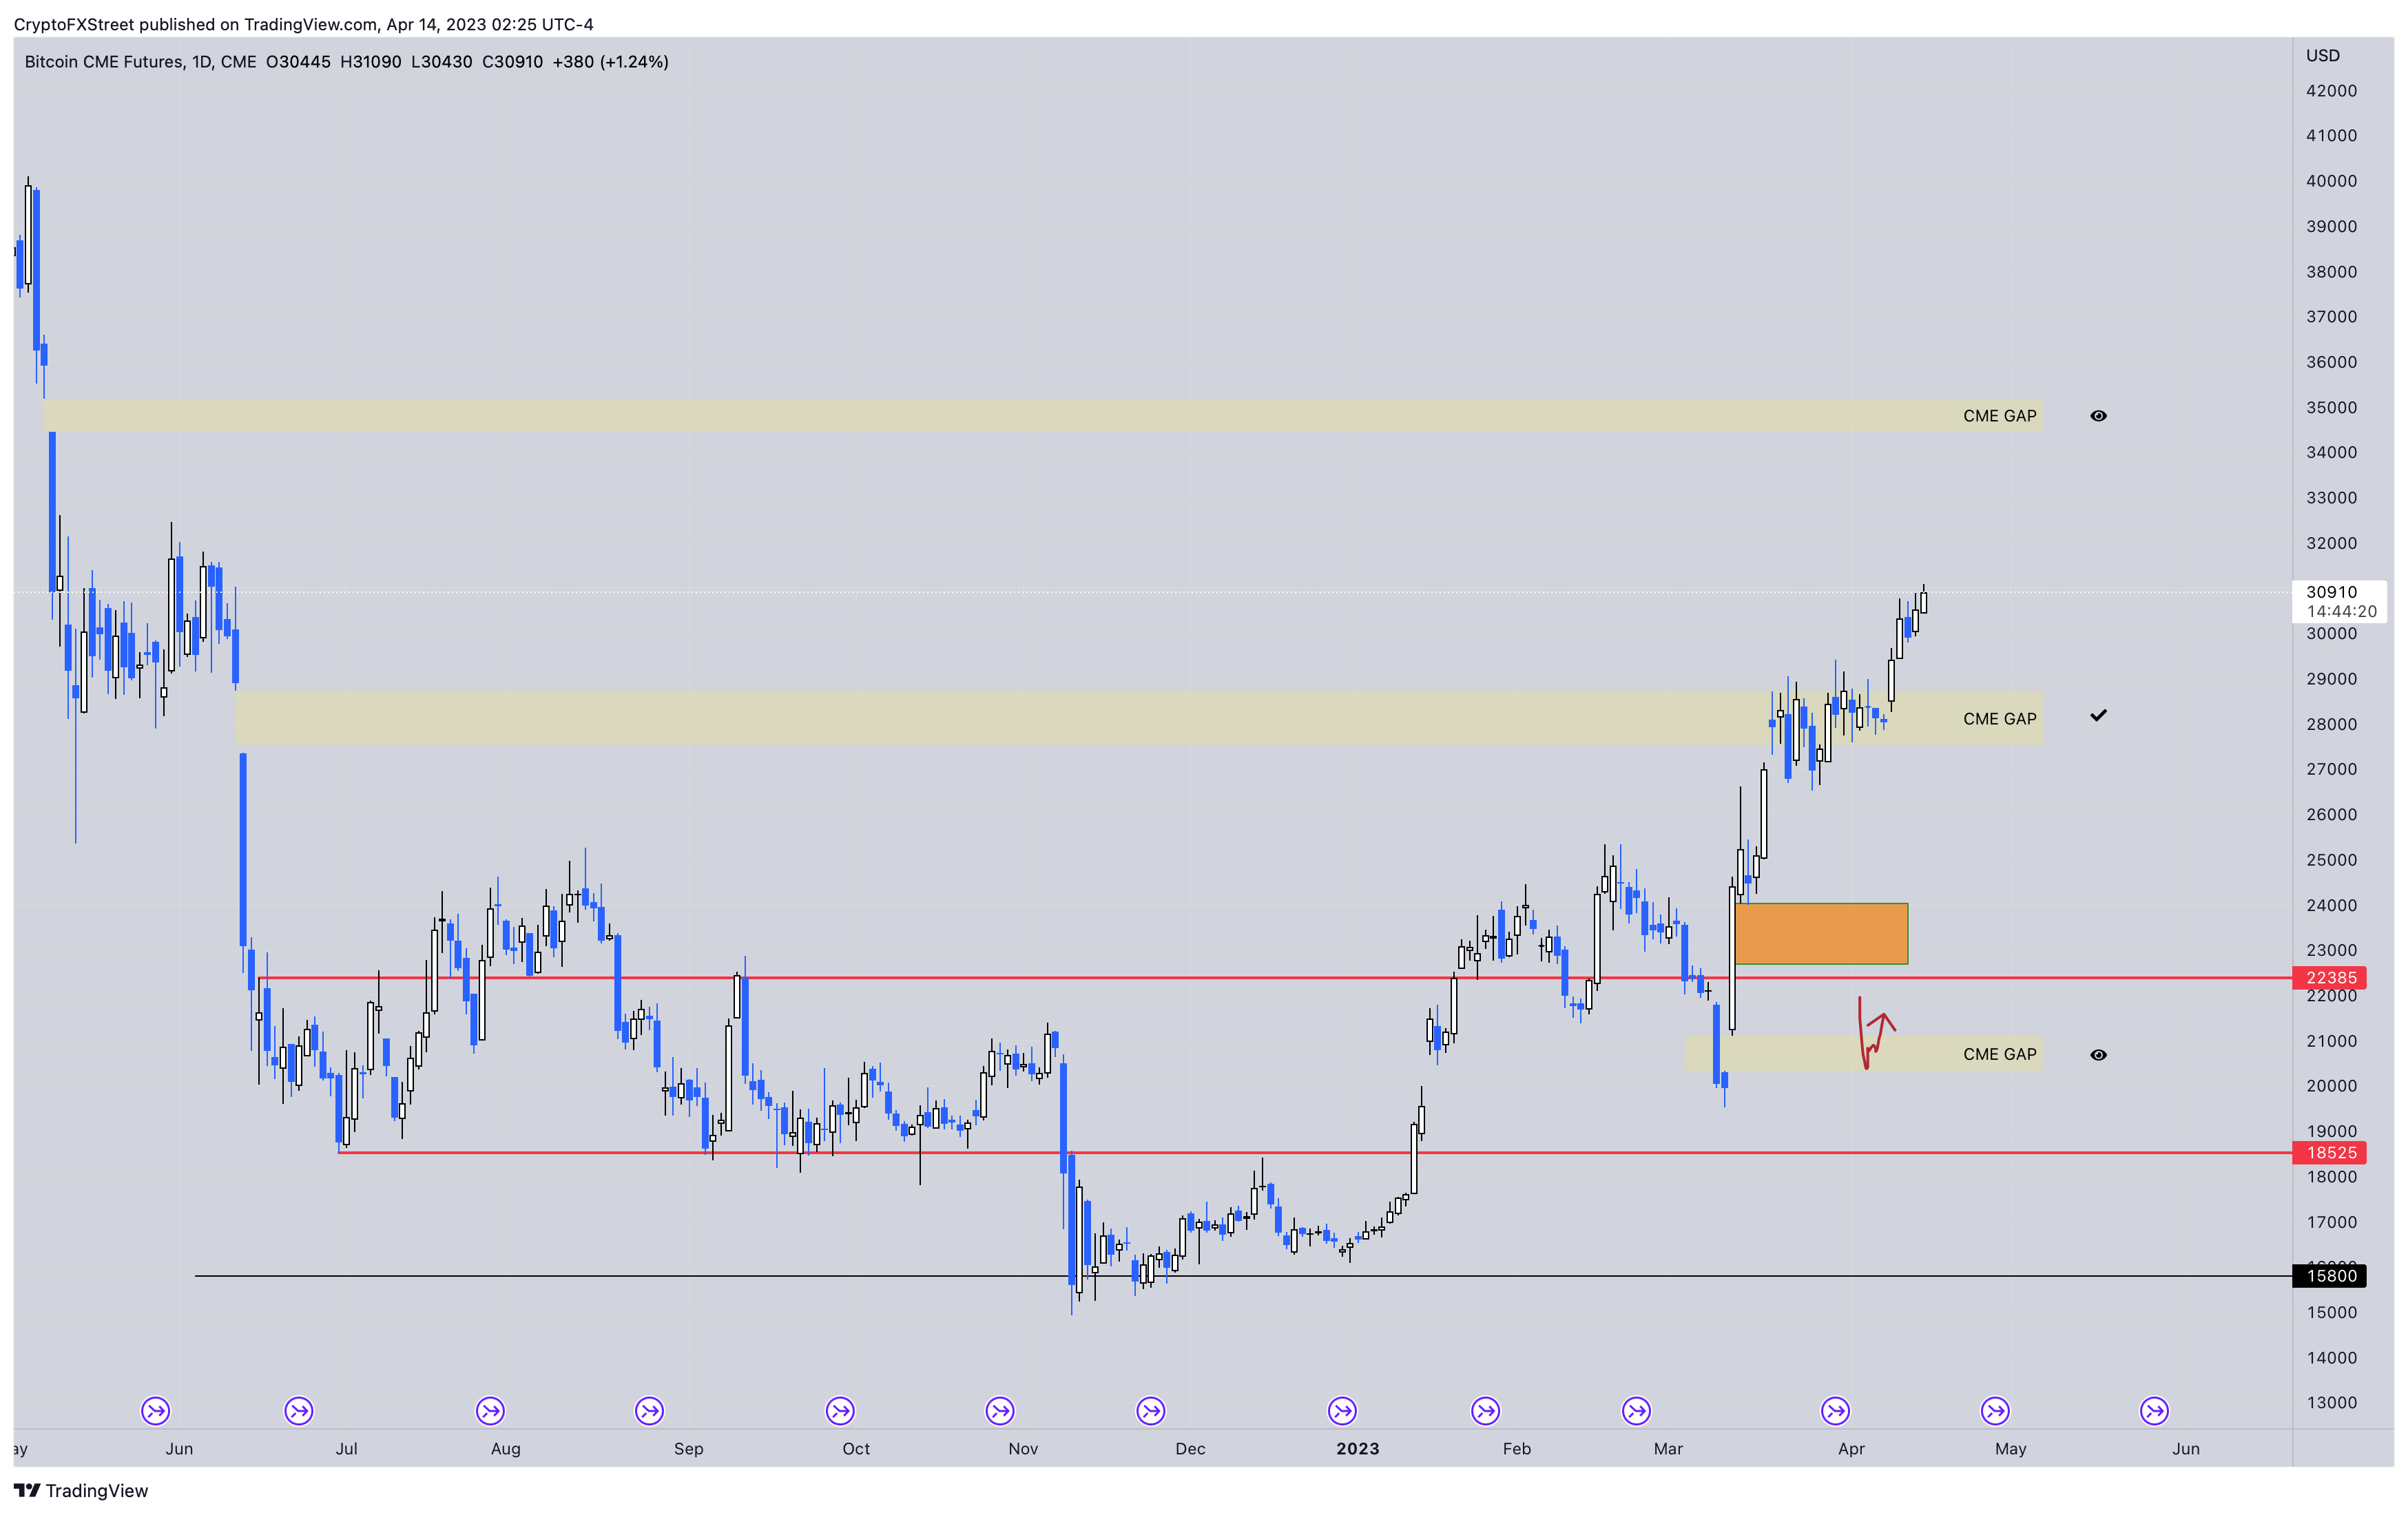
BTC/USD 1-day CME chart
Making the BTC bearish case
While the bullish outlook does make logical sense, investors need to note that while Bitcoin price has been setting up higher highs, the momentum indicators Relative Strength Index (RSI) and Awesome Oscillator (AO) have been clocking in lower highs.
This non-conformity often denotes a weakness in the system and eventually leads to a retracement in the underlying asset’s price.
As an example, Bitcoin noted a bullish divergence between June and November 2022, where the price kept making lower lows while the momentum showed a steady incline. This development was followed by a bull rally that saw BTC inflate by more than 90% in the next four to five months.
Similarly, the ongoing bearish divergence could lead to a steep correction to retest the critical support level at $24,736. In a bearish case, Bitcoin price could slide lower and tag the demand zone, extending from $19,592 to $22,291.
Author

Akash Girimath
FXStreet
Akash Girimath is a Mechanical Engineer interested in the chaos of the financial markets. Trying to make sense of this convoluted yet fascinating space, he switched his engineering job to become a crypto reporter and analyst.


