Bitcoin Weekly Forecast: The caveats to BTC’s slippery slope to $12,000
- Bitcoin price looks beaten on the three-day chart after the recent sell-off, but things could turn around.
- A retest of the $18,500 to $19,909 demand zone could trigger a recovery to $25,000.
- If BTC produces a three-day candlestick close below $18,500, it will invalidate the short-term bullish outlook.

Bitcoin price has been on a rollercoaster ride since June 18. The most recent yet explosive run-up has hit targets mentioned in our previous publication. After hitting these levels, BTC has undone these gains quickly. However, the ongoing pullback has pushed BTC back to a stable demand zone that has the potential, at least, to trigger another leg-up.
Let’s look at what transpired last week and then move to a higher time frame analysis to check the macro trend.
Bitcoin price prepares for another volatile move
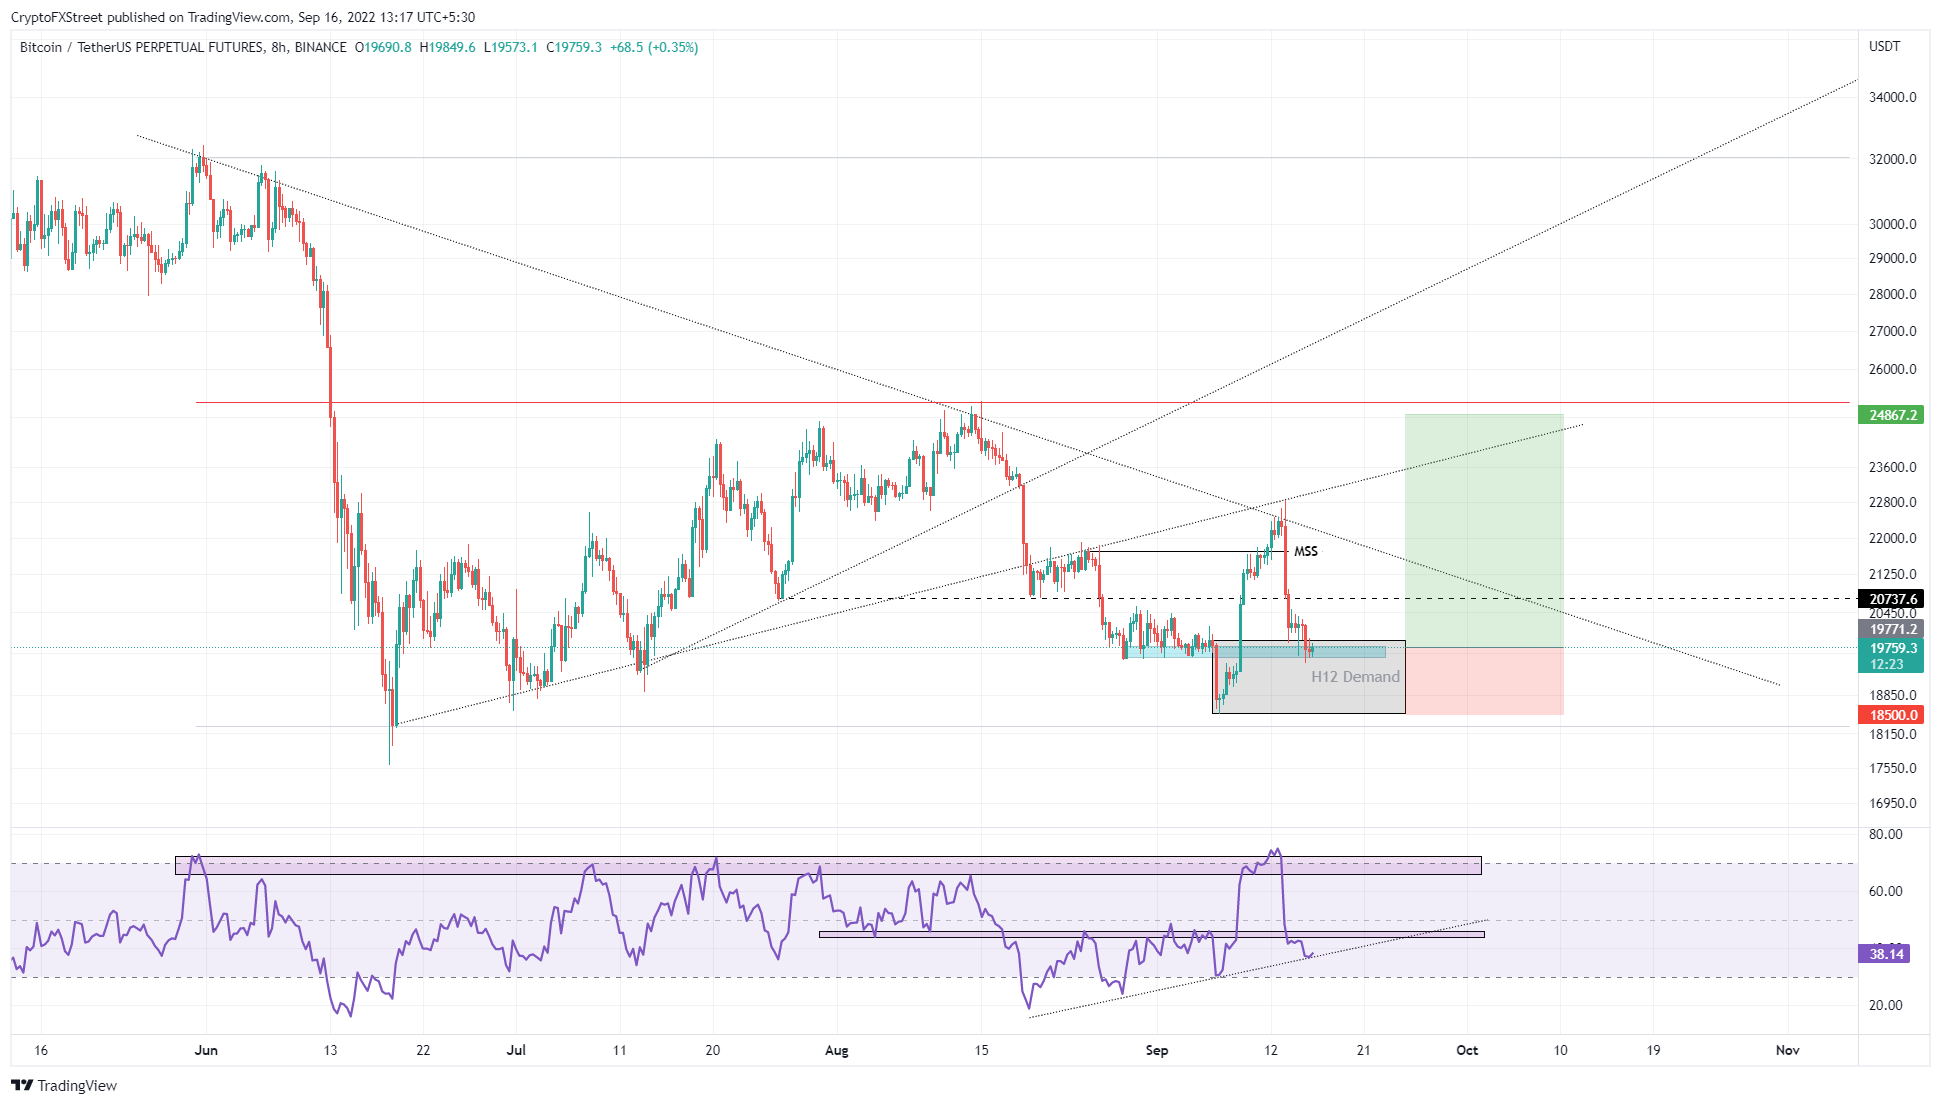
Bitcoin price rallied 23% between September 7 and 13, setting a swing high at $22,850. This swing high caused a market structure shift, aka a higher high relative to the August 24 swing high at $21,750, as seen on the eight-hour chart below.
Despite the macro bearish outlook, this development signals that the buyers and bulls are still a force to contend with and investors should prepare for the possibility of another leg-up in Bitcoin price. Interestingly, the twelve-hour demand zone, extending from $18,500 to $19,909, is one of the main reasons investors should consider this a possibility.
A confirmation of the trend reversal would come from the $19,547 to $19,784 support area. If this level holds, it signals that the buyers are looking to push the Bitcoin price higher.
The first hurdle in the bulls’ path is $20,737, clearing this barrier could potentially open the path to creating a double top at $22,850. However, if the bullish momentum is strong, this run-up could propel BTC to revisit the $25,000 psychological level, which is the midpoint of the 45% crash that occurred between June 1 and 18.
Further supporting this bullish thesis is the Relative Strength Index (RSI), which has consistently produced higher lows since August 20. Connecting these lower lows using a trend line shows that this level has been acting as a support level.
The 15% crash that occurred over the last two days seems to have pushed the RSI to retest the said trend line, indicating that a reversal here is highly likely.
BTC/USDT 1-day chart
Macro outlook and the slippery slope
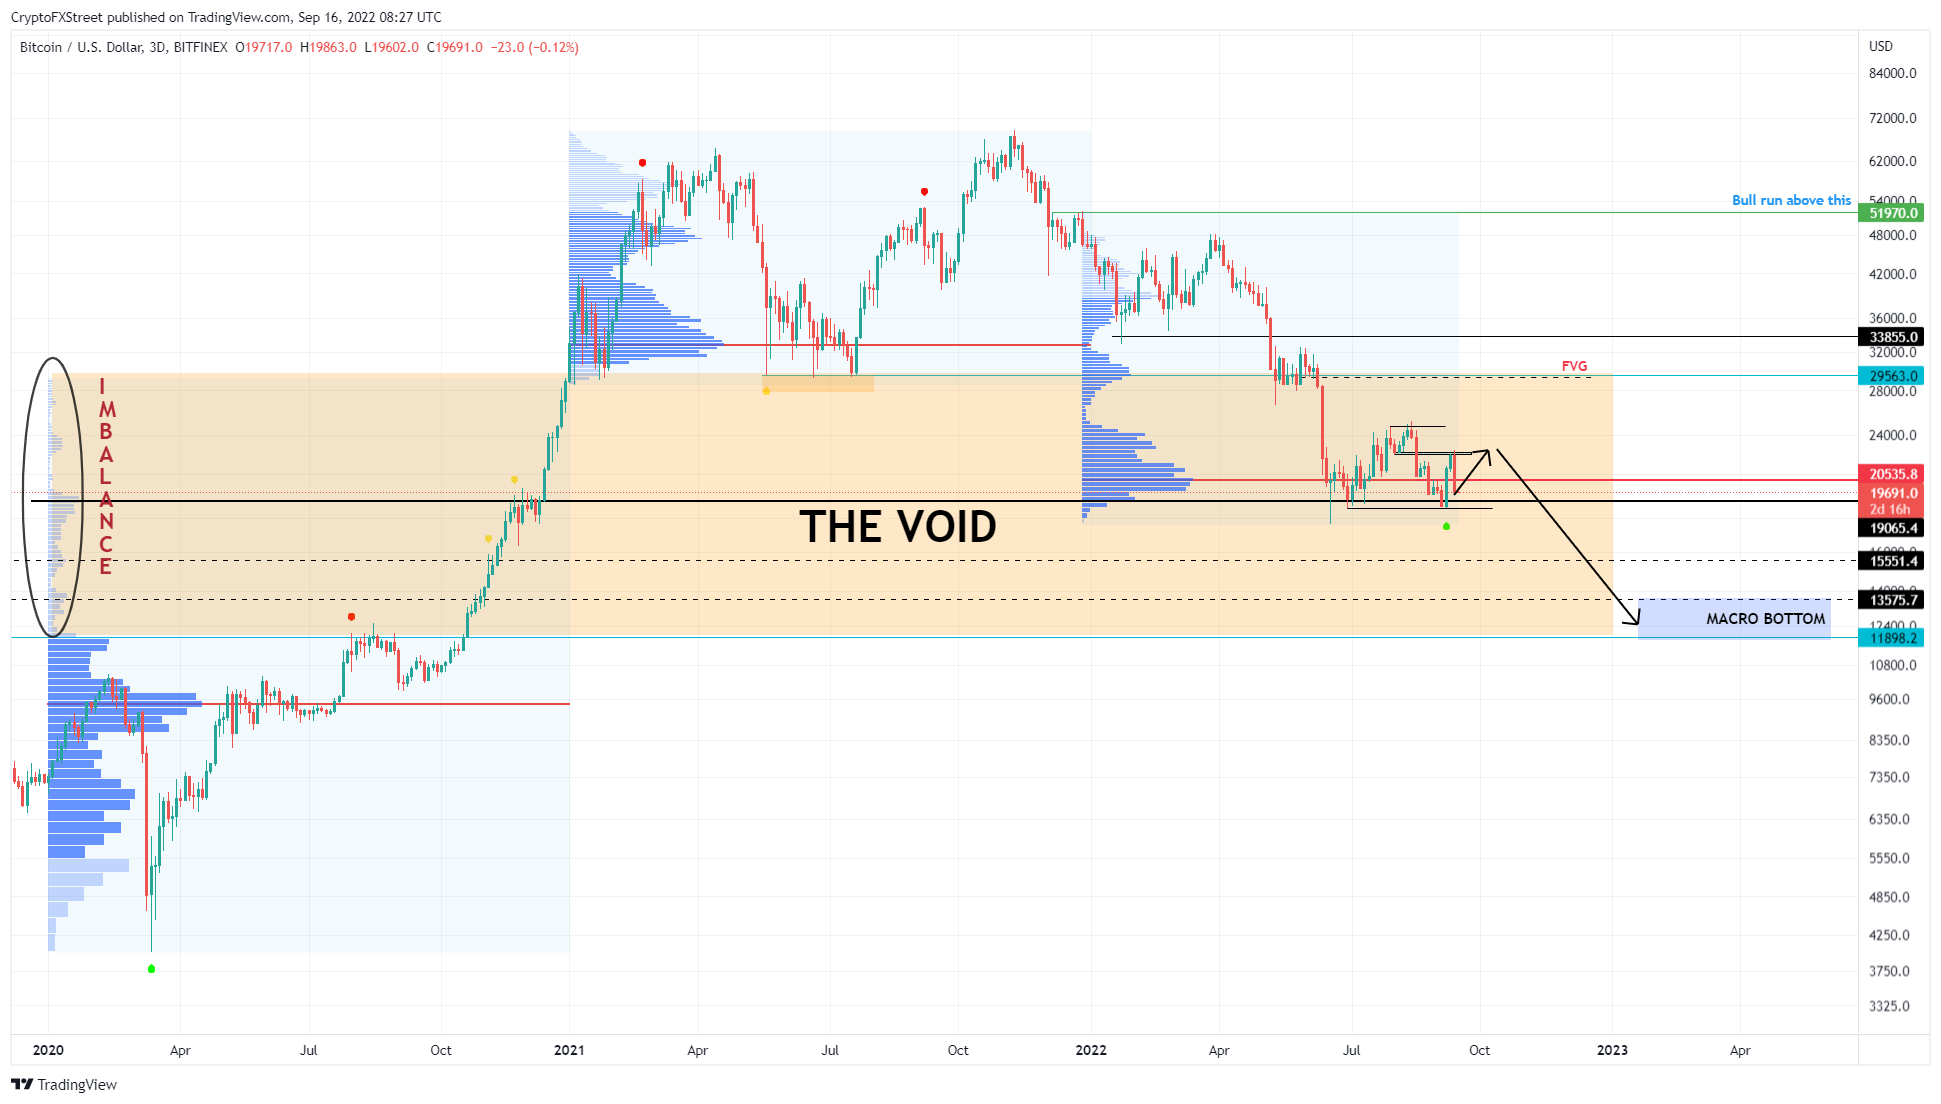
While the short-term outlook is open for a run-up in Bitcoin price, the long-term outlook continues to remain bearish. The recent crash in BTC has pushed it below 2022’s highest traded volume level at $20,535.
Without a quick recovery, Bitcoin price shows signs that it could continue adhering to its bearish outlook and crash. The first level that market makers would be interested in is the double bottom formed at $18,638.
Once this barrier is breached, it is a straight slide down to retest the minor support level at $15,551. Once that barrier is broken and Bitcoin price crashes lower, it could reach the support range, extending from $13,636 to $11,785, where the big crypto could potentially form a macro bottom.
BTC/USDT 3-day chart
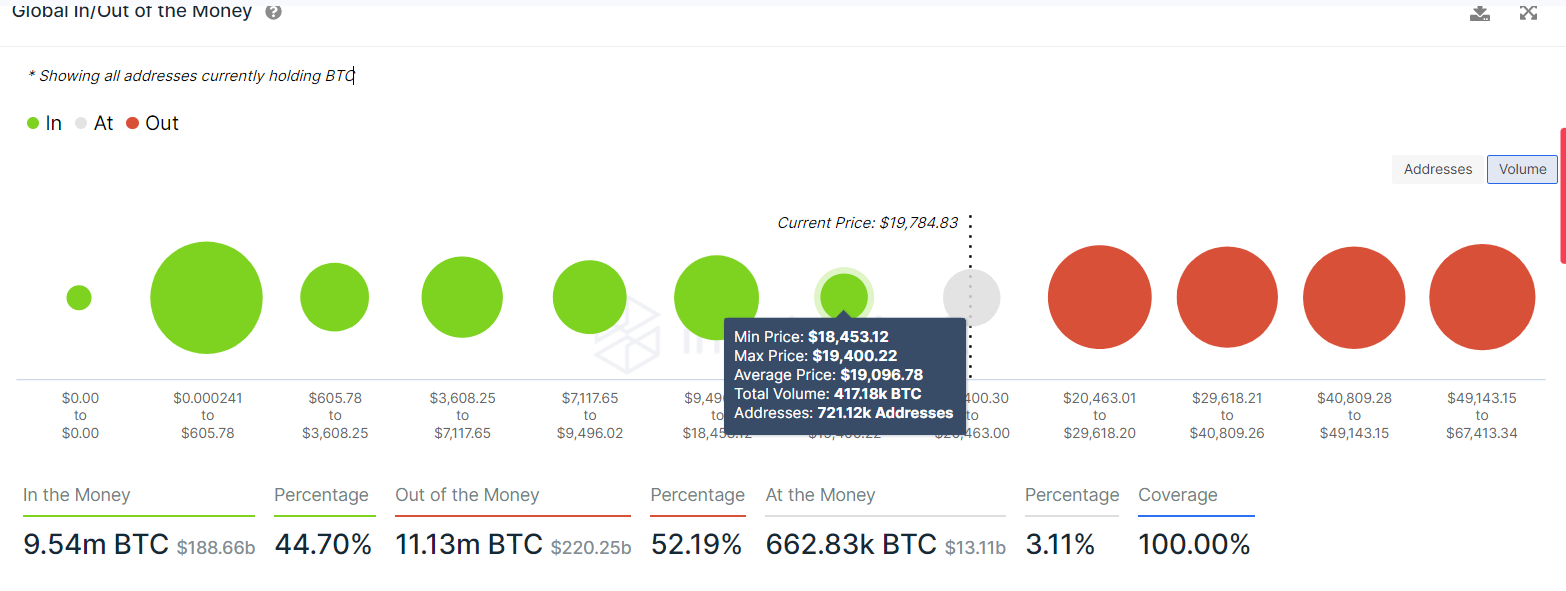
Supporting this 45% steep crash in Bitcoin price is IntoTheBlock’s Global In/Out of the Money (GIOM) model, which shows that the next support level is at $19,096, where only roughly 721,000 addresses purchased $417,800 BTC.
A breakdown of this level reveals that the next stable support floor extends from $9,496 to $18,453. Here, roughly 4.95 million addresses purchased roughly 1.72 million BTC at an average price of $12,072, which also coincides with the target predicted from a technical perspective.
BTC GIOM
The macro bear trend is persistent and is likely to persist until Bitcoin price produces a higher high on a high time frame. The first sign of this trend reversal is a flip of the $25,000 resistance level into a support floor.
Doing this will attract a decent amount of sidelined buyers and could create a positive feedback loop that pushes Bitcoin price to $29,563. If this run-up does occur, BTC could retest the $30,000 psychological level.
Author

Akash Girimath
FXStreet
Akash Girimath is a Mechanical Engineer interested in the chaos of the financial markets. Trying to make sense of this convoluted yet fascinating space, he switched his engineering job to become a crypto reporter and analyst.