Bitcoin Weekly Forecast: Is BTC sell-off over?
- Bitcoin price declined over 6% this week until Friday after the rejection of a key resistance barrier.
- Rising tensions between Iran and Israel weighed on risk assets, fueling BTC’s price decline.
- US spot Bitcoin ETFs posted $288.4 million in outflows until Thursday, indicating a fall in institutional demand.

Bitcoin (BTC) price declined over 6% this week until Friday as the escalation of the conflict between Iran and Israel added fuel to this sell-off. The decline was also supported by falling institutional demand for ETFs, which recorded outflows of more than $280 million this week. Some analysts suggest that the rising geopolitical conflicts could further escalate, pushing Bitcoin prices even lower potentially to $55,000. However, from a technical point of view, bulls seem to be holding strong at a critical support level.
Why Bitcoin dumped this week?
After ending the previous week on a bullish note, Bitcoin faced rejection on Monday. BTC fell over 3.5%, a move that could be related to lower inflows into US Bitcoin Spot Exchange Traded Funds (ETF).
On Tuesday, Bitcoin declined further, by over 4%, as Iran launched missiles at Israel. This strike came as a response to Israel’s series of attacks on Lebanon in the past weeks. Bitcoin’s price drop triggered a wave of liquidations across the crypto market, resulting in over $500 million in total liquidations and more than $140 million specifically in BTC, according to data from CoinGlass.
A report from crypto asset trading firm QCP Capital projects that Bitcoin prices could edge further down, potentially to $55,000, if geopolitical conflicts in the area further escalate.
Also on Tuesday, the Bitcoin ETF recorded an outflow of $240.60 million, the largest single-day drop since September 3, ending a streak of eight days of inflows.
Following the sharp sell-off, Bitcoin tried to recover but was unsuccessful, leading to a slight decline on Wednesday. However, the ETF data still showed an outflow of $52.90 million.
BlackRock’s historical data for Bitcoin during geopolitical tension periods shows that BTC behaves like traditional risk assets in the short term. In the long term, however, BTC has shown more resilience than Gold, the data shows.
The table below shows that, through major geopolitical events, Bitcoin’s 10-day return and 60-day return have generally performed better than Gold and the US S&P 500 equity index.
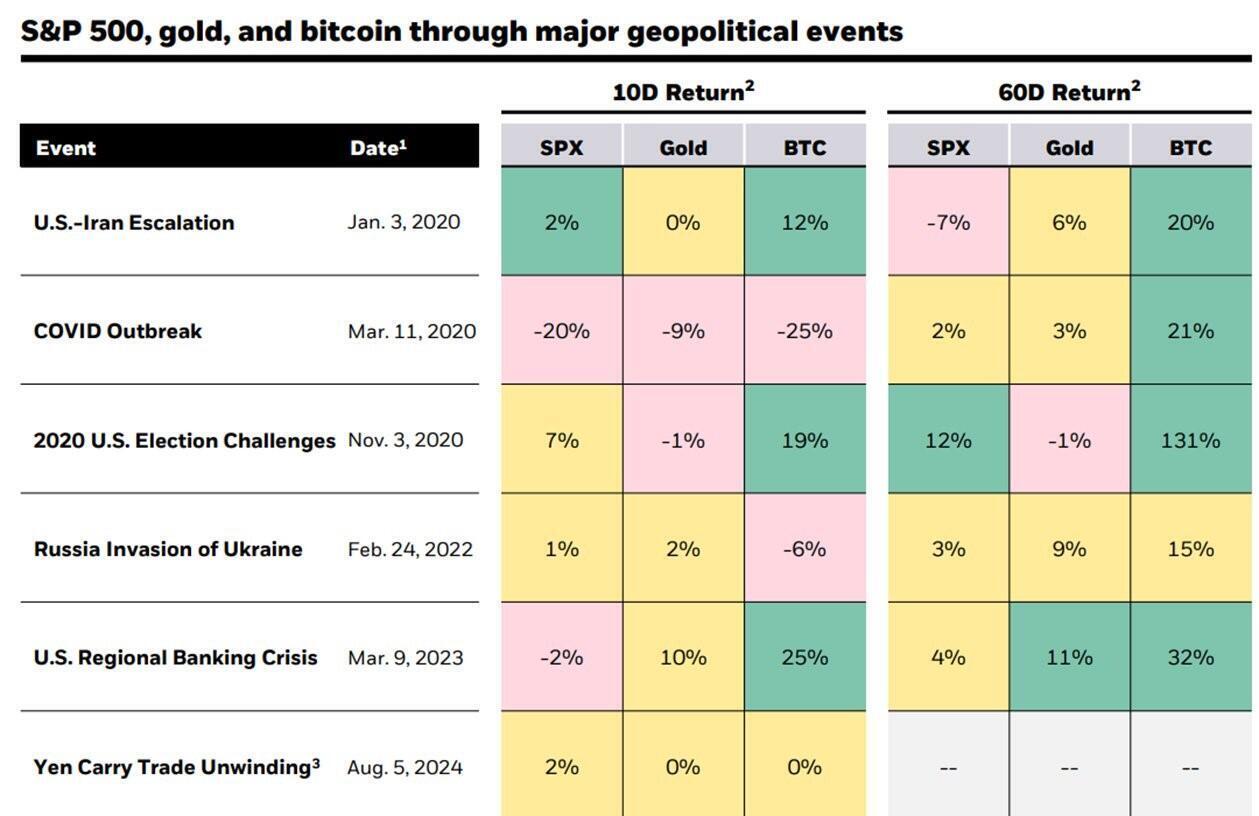
Major assets chart during geopolitical events. Source: BlackRock
On Thursday, the sell-off steam slightly cooled down. Bitcoin traded in a range, with no signs of institutional demand, as the ETF still registered an outflow of $54.20 million. On Friday, it is trying to stabilize around the $60,000 mark.
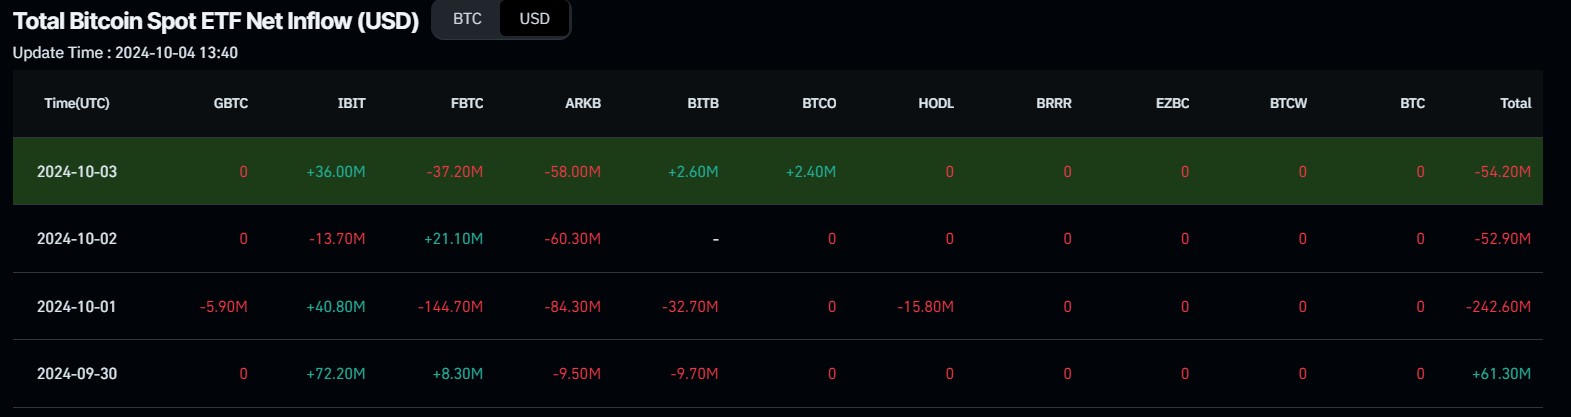
Bitcoin Spot ETF Net Inflow chart. Source: Coinglass
Bitcoin technical outlook
Bitcoin’s weekly chart shows that, after three straight weeks of rally in September, the biggest crypto asset by market capitalization faces resistance after testing the descending trendline, declining over 6% so far until Friday.
This descending trendline (formed by connecting multiple weekly closes since the end of March) roughly coincides with the weekly resistance level of around $65,800, making it a key resistance zone. If BTC continues its decline, it could fall further to retest its next weekly support around $55,400, which roughly coincides with its 50-weekly Exponential Moving Average at $55,336.
The momentum indicator Relative Strength Index (RSI) hovers around its neutral level of 50, indicating indecisiveness among the traders. The ongoing decline could continue if the RSI falls decisively below its neutral level.
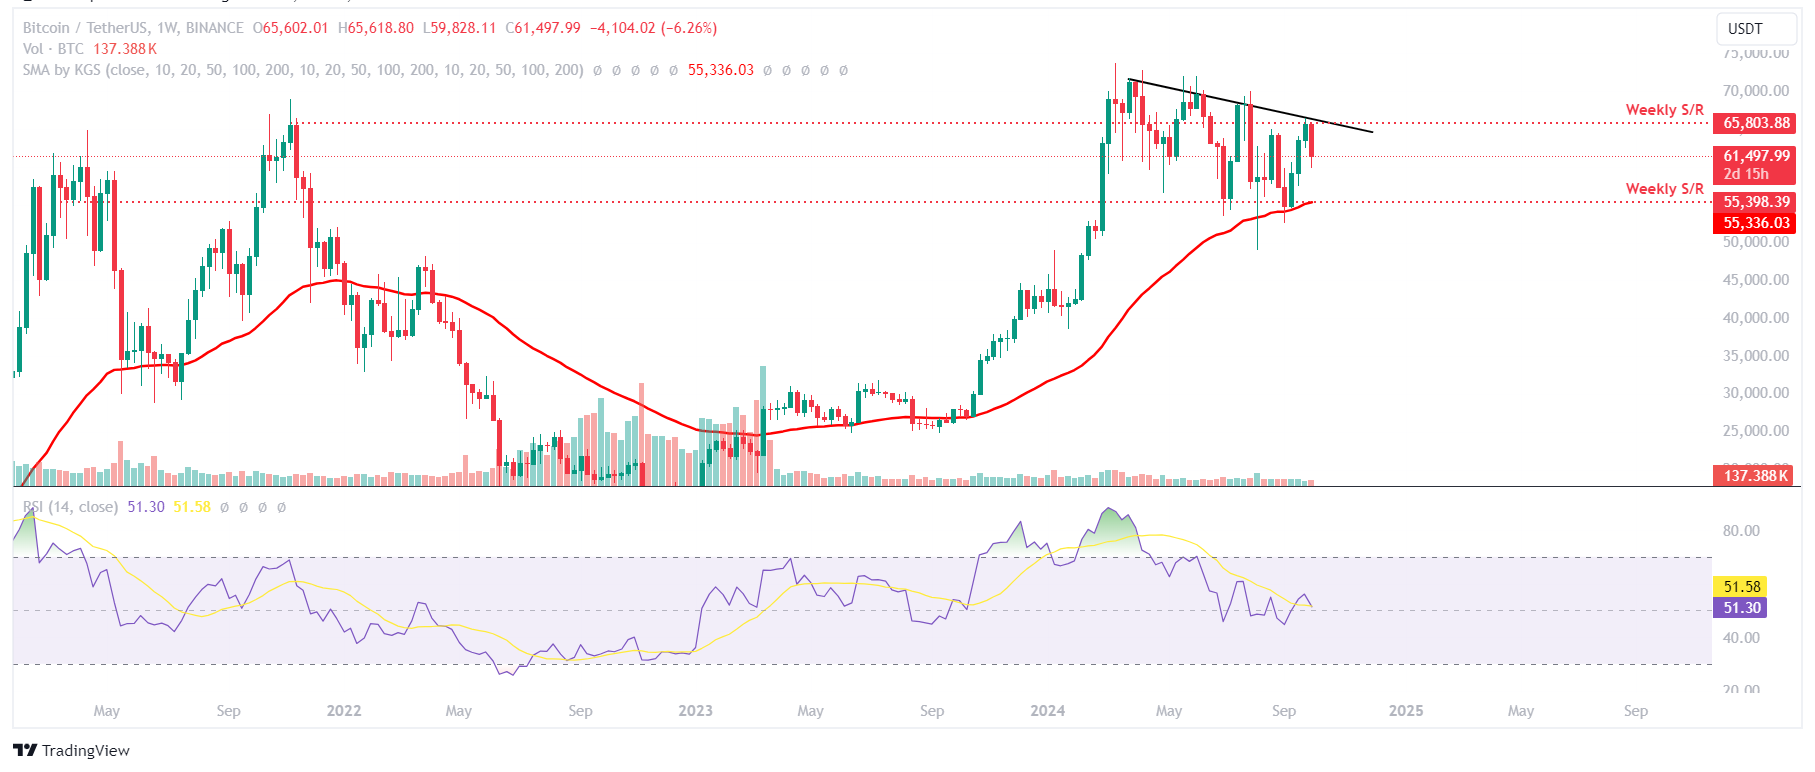
BTC/USDT weekly chart
The daily chart, however, shows some signs of a cooldown from the recent sell-off. On Wednesday, BTC found support around its 200-day EMA at $59,904. As of Friday, it trades above $61,500.
If this support holds, BTC could rise to retest its 61.8% Fibonacci retracement level around $62,000. A successful close above it could extend the rise to the $66,000 mark. Friday’s rise has set the RSI technical indicator slightly into recovery mode as it aims to close above 50. For BTC to recover, the RSI should trade above this neutral level.
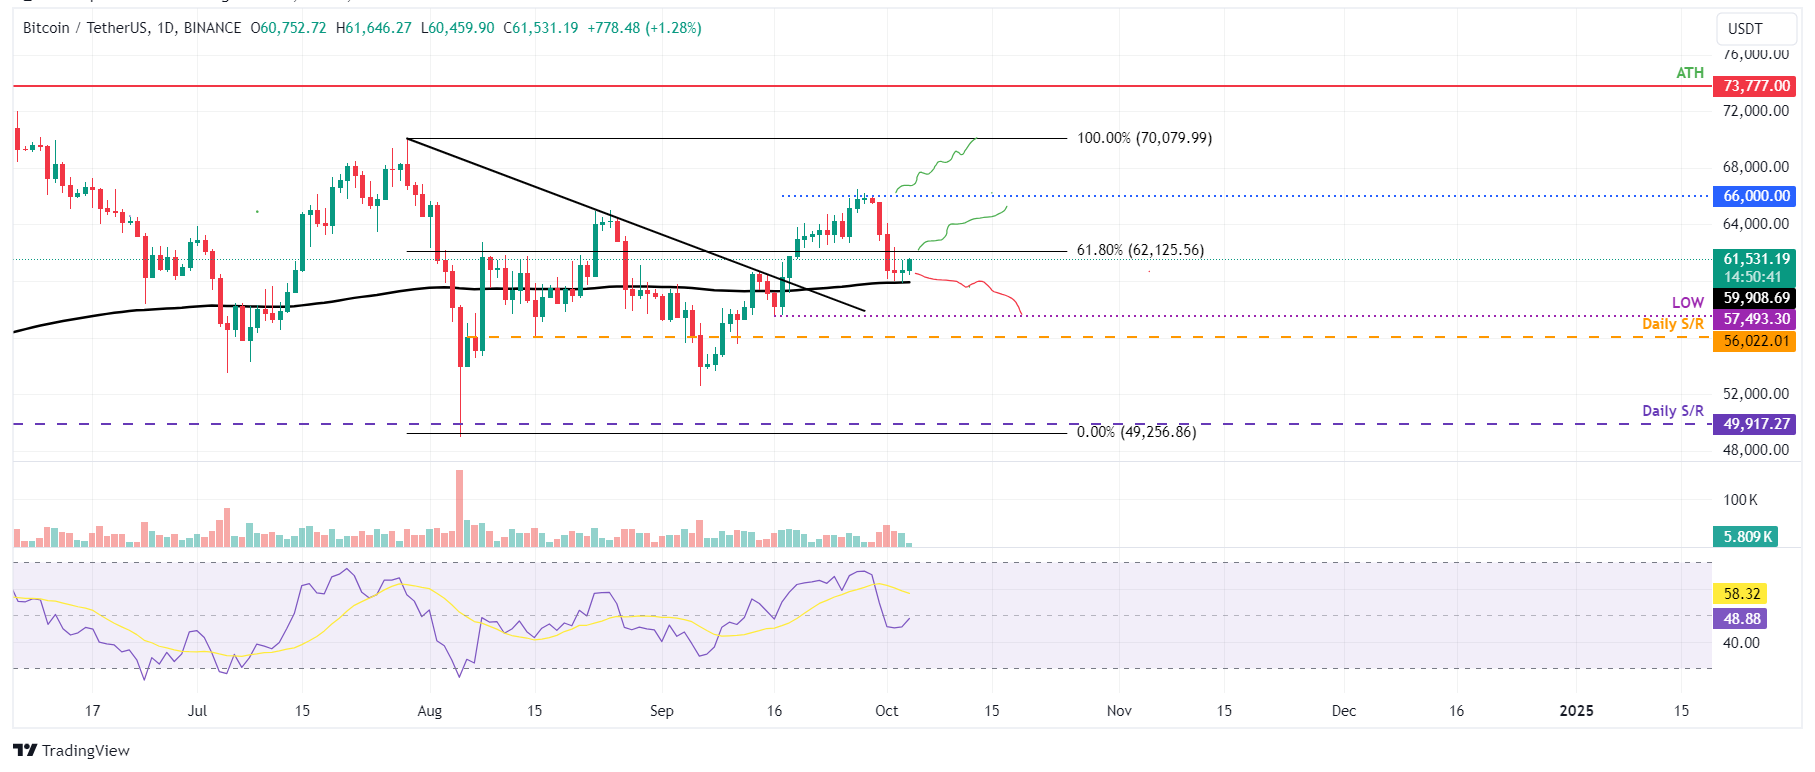
BTC/USDT daily chart
Author

Manish Chhetri
FXStreet
Manish Chhetri is a crypto specialist with over four years of experience in the cryptocurrency industry.


