Bitcoin Weekly Forecast: Is BTC out of the ‘bearish’ woods yet?
- Bitcoin price has overcome the 200-week SMA and 30-day EMA, denoting a major surge in bullish momentum.
- As a result, BTC could revisit anywhere from $25,000 to $30,000 soon.
- A daily candlestick close below 200 four-hour SMA at $21,117 will invalidate this bullish thesis.

Bitcoin price has been extremely bullish ever since July 26, when it kick-started a second bullish leg. Regardless, BTC is yet to face another hurdle that will determine if there are buyers with conviction behind the recent run-up or if it is built on weak-handed longs.
Bitcoin price needs to overcome one more level
Bitcoin price set the last notable swing high on May 31 at $32,375 and dropped roughly 45% in the two weeks or so that followed. This move created a new yearly low at $17,592 and encouraged many investors to scoop up BTC at a discount.
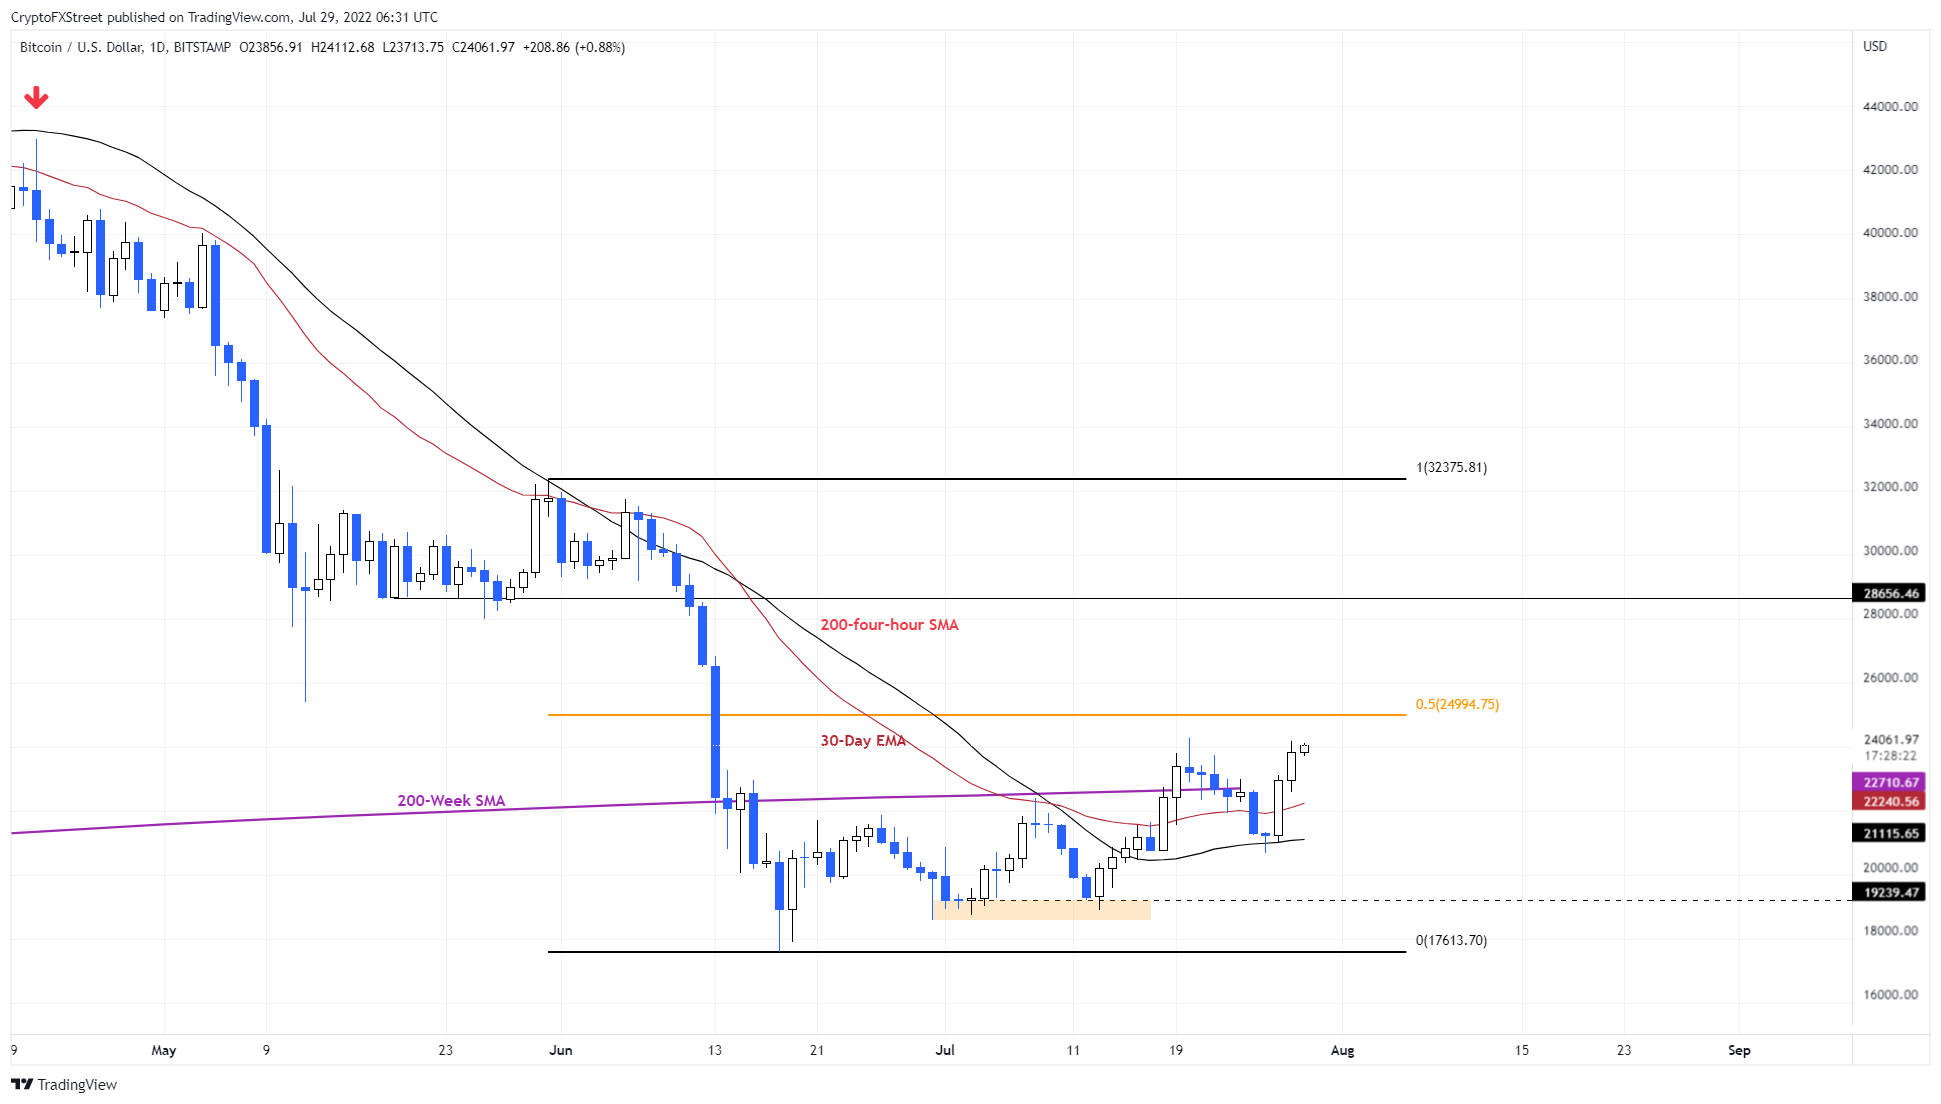
Since then, the big crypto has been consolidating, but using the Fibonacci retracement tool shows that the midpoint of this nosedive is at $25,000.
Many investors rushed to buy BTC at a discount, which created a double bottom pattern on July 3 and July 13, around the $19,239 support level. The result of this formation was a 29% rally that smashed through the 200 four-hour Simple Moving Average (SMA) at $21,116, the 30-day Exponential Moving Average (EMA) at $22,245 and the 200-week SMA at $22,710.
If this trend continues, the next level Bitcoin price will encounter is the midpoint of the previously mentioned range at nearly $25,000.
Judging by the consolidation that occurred between May 13 and June 11, the $28,656 will be the next resistance level that BTC will encounter should it ever overcome the $25,000 barrier.
So, in total, Bitcoin price could rally anywhere between 4% to 19% in the coming weeks.
BTC/USDT 1-day chart
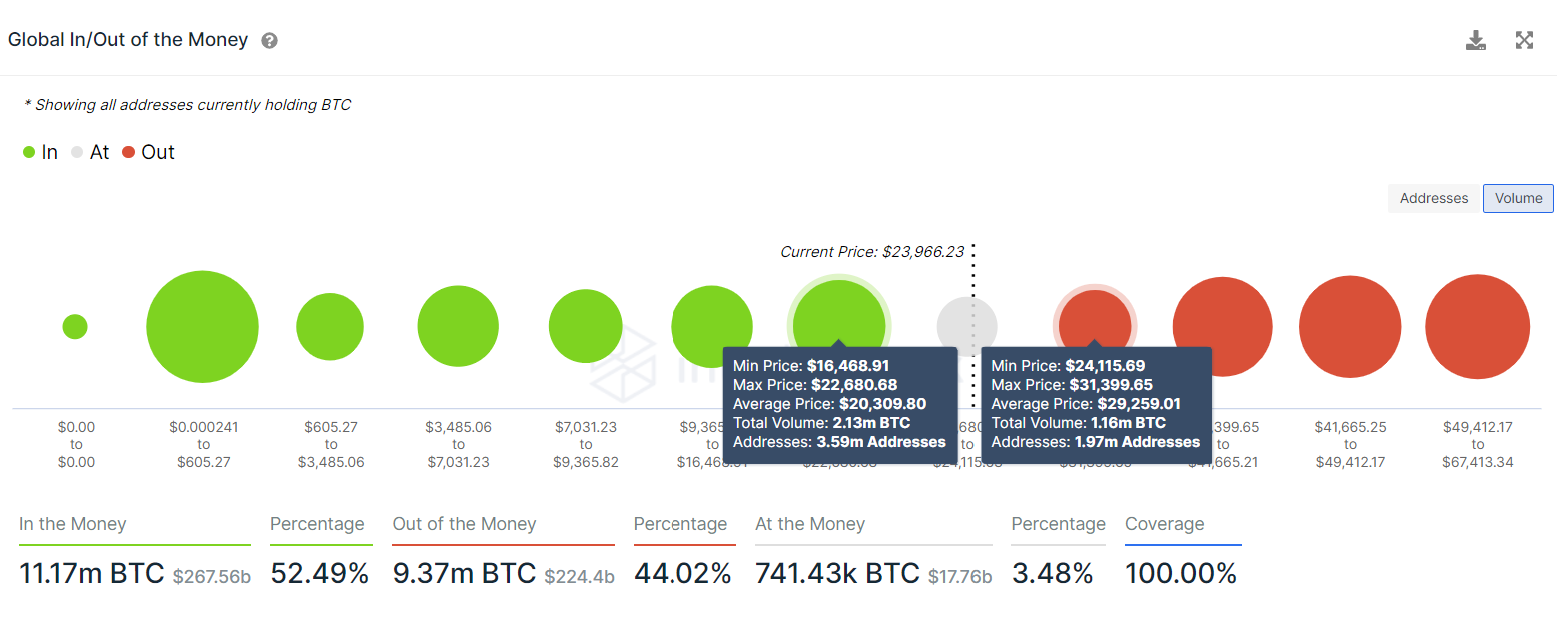
Adding credence to this scenario is IntoTheBlock’s Global In/Out of the Money (GIOM) model. This on-chain index shows that the next cluster of underwater investors extends from $24,100 to $31,400. Here, roughly 1.97 million addresses that purchased roughly 1.16 million BTC at an average price of $29,259 are “Out of the Money.”
Interestingly, this level falls in line with the target obtained from a technical perspective ($28,656). Due to the results’ confluence, investors should expect an 18% run-up in Bitcoin price soon.
BTC GIOM
Three signs of trend exhaustion
Bitcoin price rally has been a relief to investors, no doubt, but the double bottom created around the $19,239 support level has sell-side liquidity resting below it. Hence, a breakdown of this trend that pushes BTC back below the 200-week SMA at the $22,710 support level will be the first sign of weakness.
Observing the weekly close will provide a much better outlook in this regard.
Furthermore, a breakdown of the 30-day EMA at $22,245 will indicate that the daily trend is also collapsing and will serve as a tailwind for the bearish pressure.
The final nail in the coffin would be a daily candlestick close below the 200 four-hour SMA at $21,115.
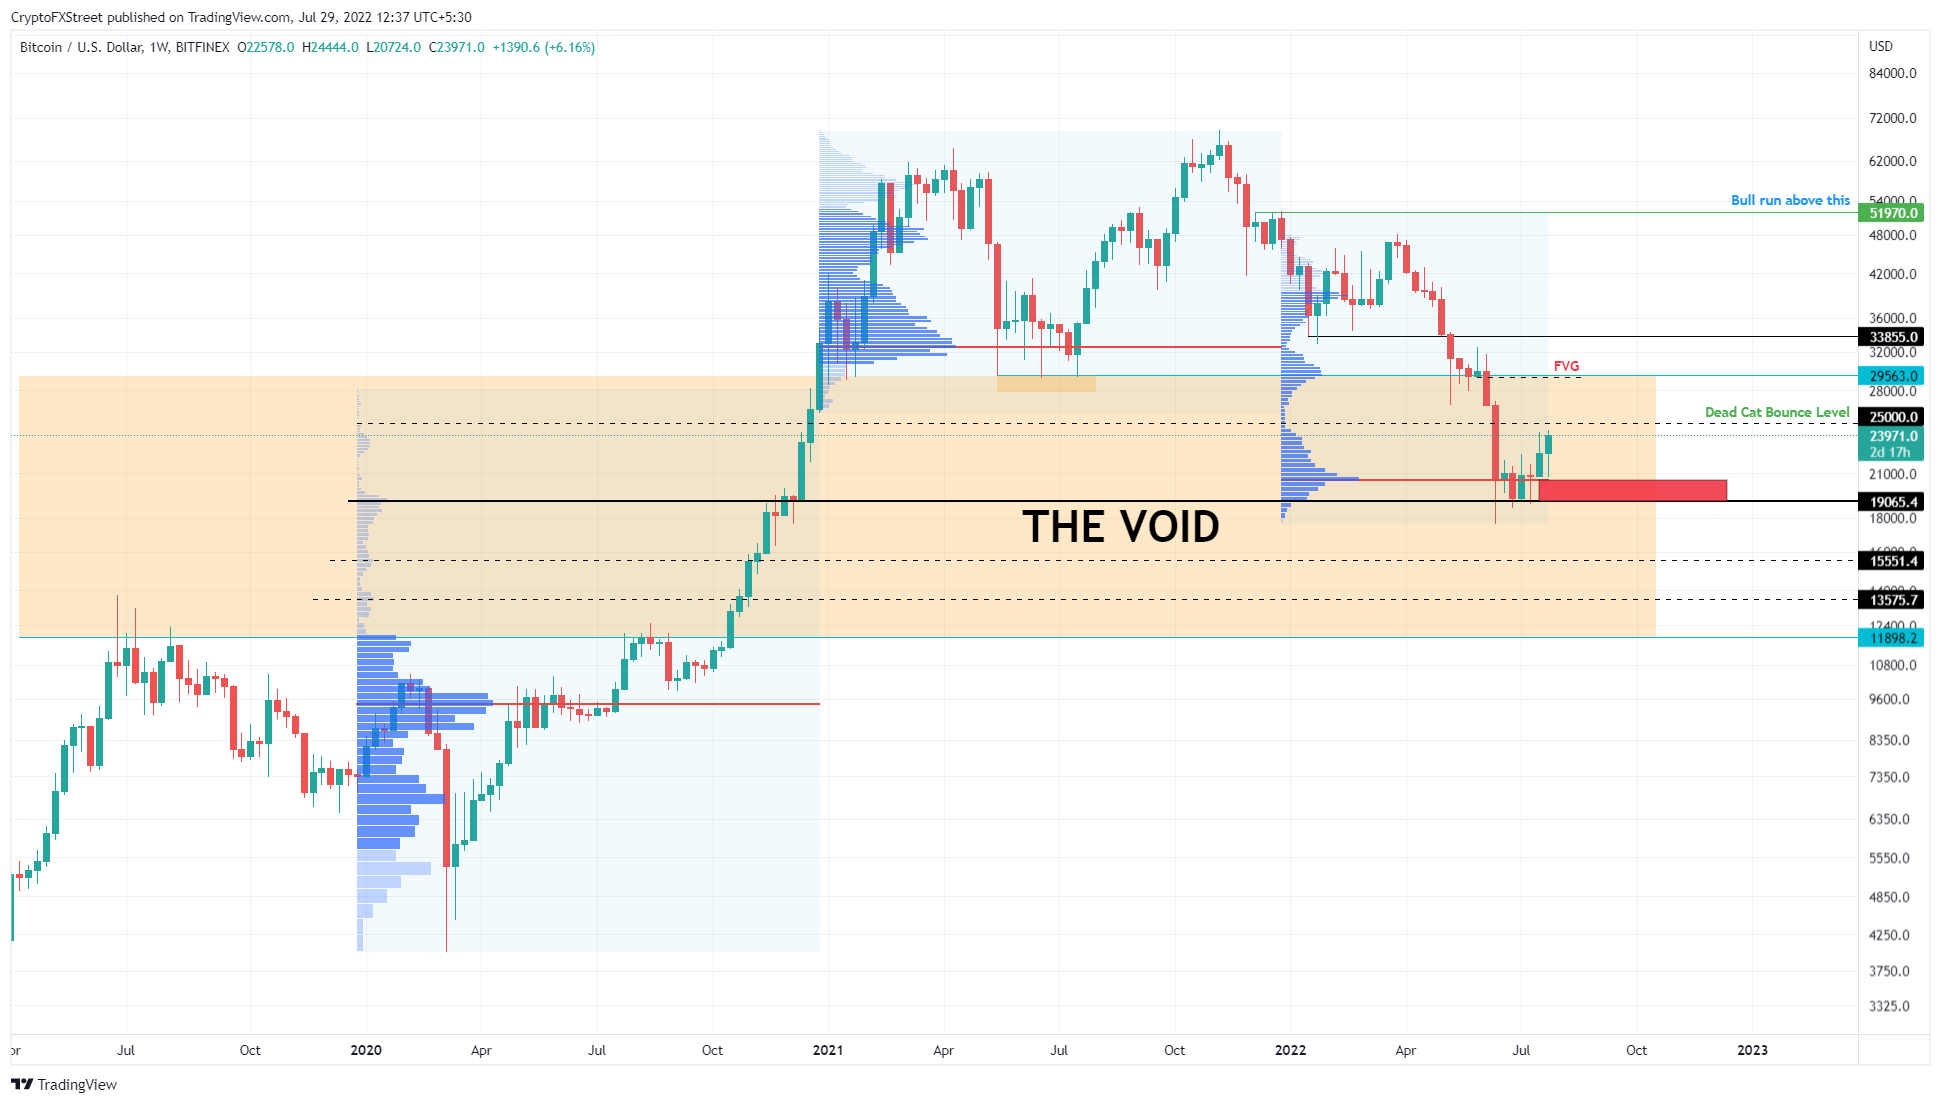
If these conditions are met, investors should exercise caution and refrain from taking massive risks. Beyond the $21,115 barrier rests a massive yet stable support area, extending from $20,000 to $19,000.
This level is a make-or-break point for Bitcoin price since it consists the 2022’s highest traded level, aka point of control, and also the weekly support level at $19,000.
BTC/USD 1-week chart
Therefore, a breakdown of this support area will spell trouble not just for bulls but also for the investors that purchased BTC at $17,000 as it could trigger a crash to $11,898.
Author

Akash Girimath
FXStreet
Akash Girimath is a Mechanical Engineer interested in the chaos of the financial markets. Trying to make sense of this convoluted yet fascinating space, he switched his engineering job to become a crypto reporter and analyst.