Bitcoin Weekly Forecast: If bulls are back, this is where you can accumulate BTC next
- Bitcoin price breaks out from its downtrend resistance level, suggesting a resurgence of a bullish outlook.
- Technicals and on-chain metrics hint at a minor pullback that could knock BTC as low as $19,250.
- Invalidation of the bullish outlook will occur if BTC slips below the $19,250 support level on a three-day or weekly chart.

Bitcoin price shows a lack of momentum after an explosive move in the last three weeks. The fourth week has been relatively silent, without a lot of volatile moves. While BTC consolidates, other altcoins are rallying left and right, providing massive gains.
Bitcoin price and its next move
Bitcoin price has expanded by 45% in the last four weeks, with the most volatile move taking place in the first three weeks. While the last few days have resulted in a consolidative structure, from a long-term perspective, BTC looks bullish.
This rally has pushed BTC to produce a higher high above the November 5 swing high at roughly $21,400, However, the last significant high that resulted in a lower low was $25,205, formed on August 14. Therefore, a higher high above this level will provide further confirmation of the start of a new uptrend.
Until then, there is a good chance Bitcoin price might pull back to critical support levels, but if the sellers band together, this move could transform into a sell-off. Identifying the crucial bouncing platforms is crucial.
The three-day chart shows that the immediate support level is the $21,481 barrier, beyond which is the 2023 Point of Control (POC), which is the highest volume traded in 2023. If these levels fail to hold, then buyers are likely to step in at the 2022 POC at $19,250.
These three support levels are key accumulation zones from a technical point of view.
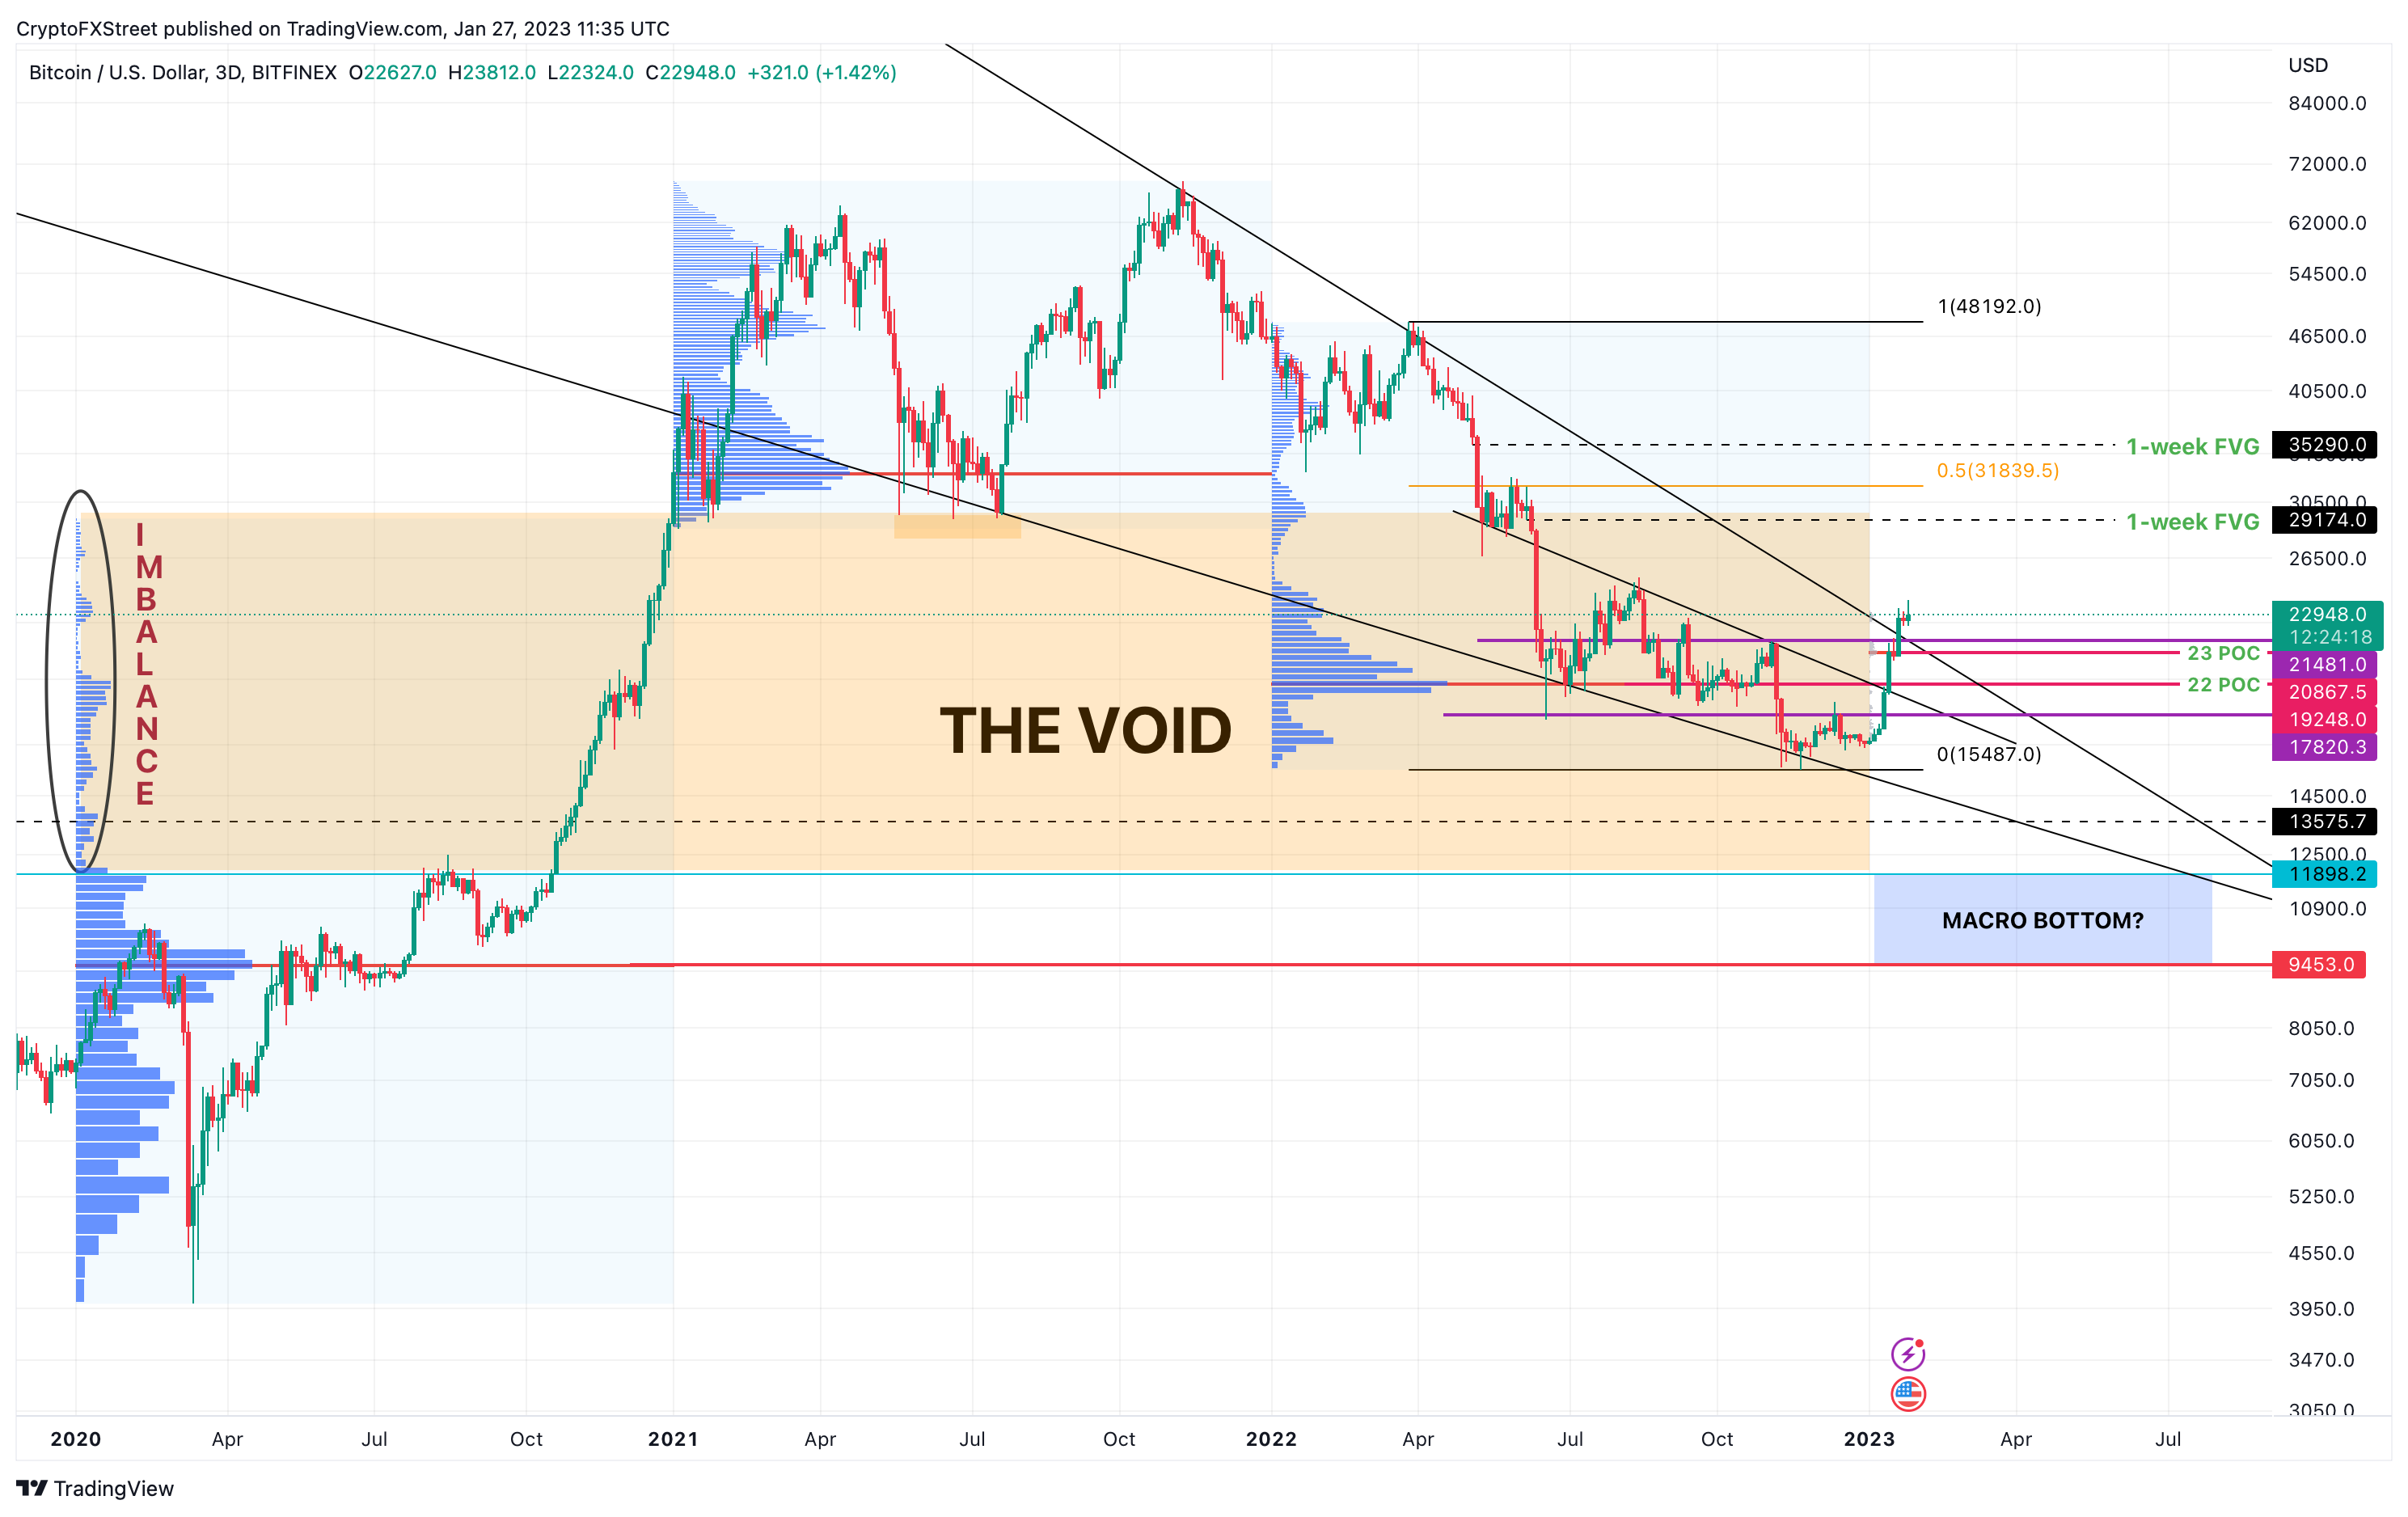
BTC/USDT 3-day chart
Adding credence to this pullback thesis is the 30-day Market Value to Realized Value (MVRV) for Bitcoin price. This index is used to determined the average profit and loss of investors. Currently, the MVRV hovers around 16%, which is the average profit of addresses that purchased BTC in the last month.
Historical data shows that when the 30-day MVRV is in the 12% to 21% zone Bitcoin price has formed a local top. Therefore, market participants need to be cautious as these in-the-money investors could sell their holdings to realize profits, triggering a pullback.
%20[18.12.33,%2027%20Jan,%202023]-638104201664574116.png)
BTC 30-day MVRV
A retracement to $19,250 or any support levels above it will be a good place to accumulate. The bounce from these barriers could trigger a spike in buying pressure that propels Bitcoin price to to tag the next crucial zone, extending from $28,000 to $30,000.
Beyond these levels, $31,840 is a key level as it is the midpoint of the 67% crash between March and November 2022.
Impact of FOMC, CPI and US Dollar on crypto market
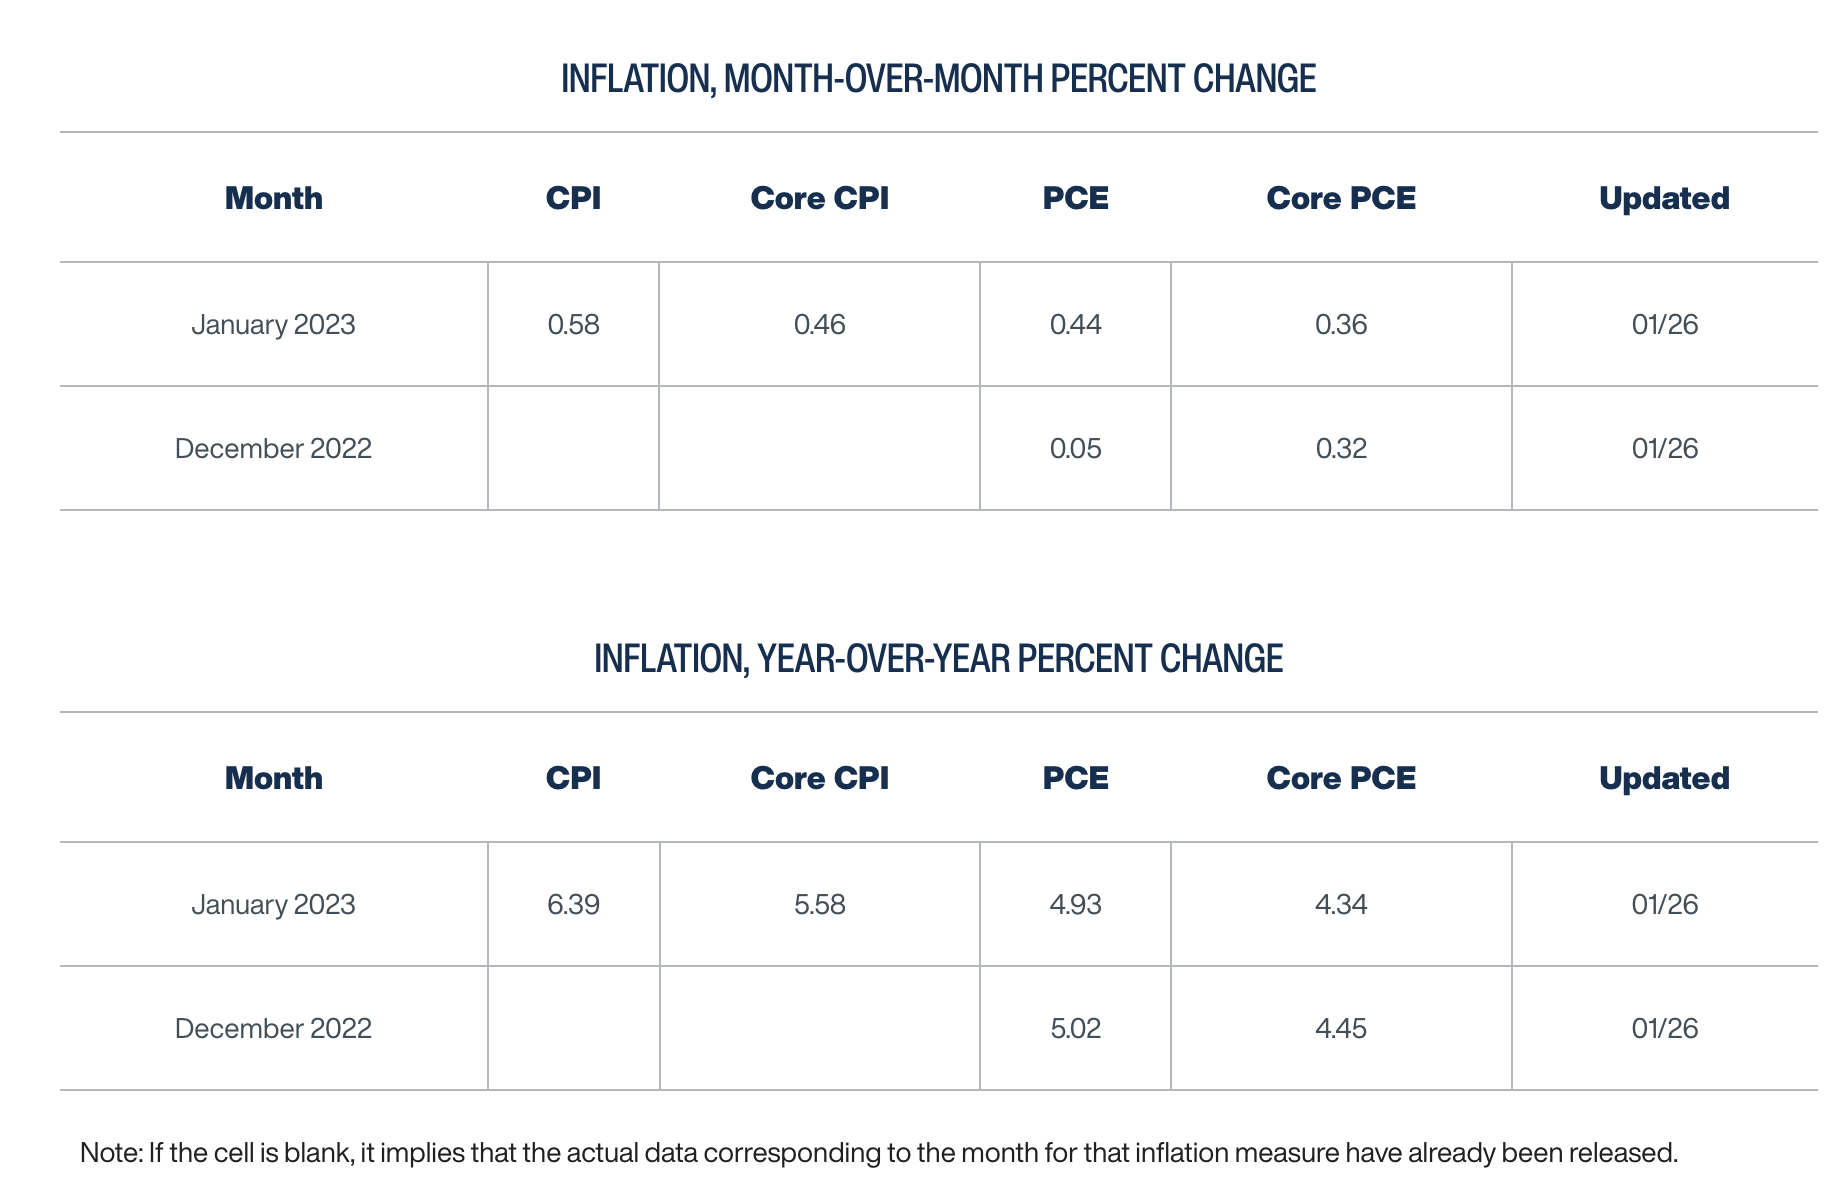
QCP Capital ,a crypto trading firm based out of Singapore, mentioned that “market has been signalling to the Fed that talk is cheap” which puts a lot of importance on the Consumer Price Index (CPI) announcement on February 14.
The Federal Reserve uses CPI and nonfarm payrolls numbers to assess inflation which it is tasked with maintaining at around its 2% target. When inflation is high, the Fed raises interest rates to bring it down, encouraging people to save ratherthan borrow and spend. The Cleveland Fed's inflation Nowcast model forecasts a 0.6% month-over-month CPI. Compared to the previous month’s 0.3%, this is a massive spike in inflation.
QCP Capital mentions that this forecast could be a “complete curveball at the market's optimistic view on inflation.”
Cleveland Fed’s inflation Nowcast model
While there is time for this forecast to be revised and inflation numbers to come down, investors need to be cautious. If this number does not reduce, it will warrant a higher increase ininterest rates by the Federal Reserve, causing the US Dollar to spike higher.
A stronger Dollar would cause risk-on assets like stocks and cryptocurrencies to sell-off. Hence, a higher month-over-month CPI could add a considerable spike in downward pressure for Bitcoin price. Or the expectation of a higher CPI could catalyze a trend reversal for the cryptocurrency ecosystem beforehand, which has already enjoyed a four-week uptrend.
While pullback does seem likely for Bitcoin price, a sudden spike in selling pressure that knocks BTC to produce a three-day or weekly candlestick close below $19,250 will invalidate the bullish outlook.
In such a case, Bitcoin price could target the equal lows and the sell-stop liquidity resting below $15,443.
Author

Akash Girimath
FXStreet
Akash Girimath is a Mechanical Engineer interested in the chaos of the financial markets. Trying to make sense of this convoluted yet fascinating space, he switched his engineering job to become a crypto reporter and analyst.


