Bitcoin Weekly Forecast: BTC’s Q3 close and what to expect in Q4?
- Bitcoin price has developed a bullish divergence with RSI, hinting at more upside.
- Despite the optimistic technicals, investors should expect volatile swings before the end of the third quarter of 2022.
- A break under and flip of the $17,593 level into a resistance level will invalidate the bullish thesis for BTC.

Bitcoin price is trading above two crucial levels, suggesting a stable foothold. Combining this outlook with a bullish divergence signal, BTC holders should expect a favorable outcome. However, since the third quarter will end in a few hours, there is bound to be abnormal volatility in the market, which could trigger massive moves in either direction, so investors need to be cautious.
Bitcoin price and the start of a new quarter
Bitcoin price formed a firm bottom on June 30 at $19,230, which was followed by a 31% ascent that set up a swing high at $25,205. After that, an exhaustion of the move’s momentum combined with investors booking profits, saw markets turn around and resulted in a 27% crash that formed another bottom at $18,210 on September 19.
These lower lows might indicate a bearish outlook, but the Relative Strength Index (RSI) shows that whilst price was falling it was rising, indicating a bullish divergence. This technical formation reveals a lack of selling pressure and can be a signal the market will reverse and start moving higher.
As sellers lose steam, Bitcoin price will reflect what can be already seen in the momentum - a bullish resurgence, triggering a run-up. The resulting move could push BTC up by 20% before encountering the 200-weekly Simple Moving Average (SMA), which is the most significant hurdle.
If the momentum is strong enough to flip this blockade, Bitcoin price could reach the next resistance level at $29,563. This move would constitute a 48% gain from the current position and is likely where the upside is capped for the big crypto.
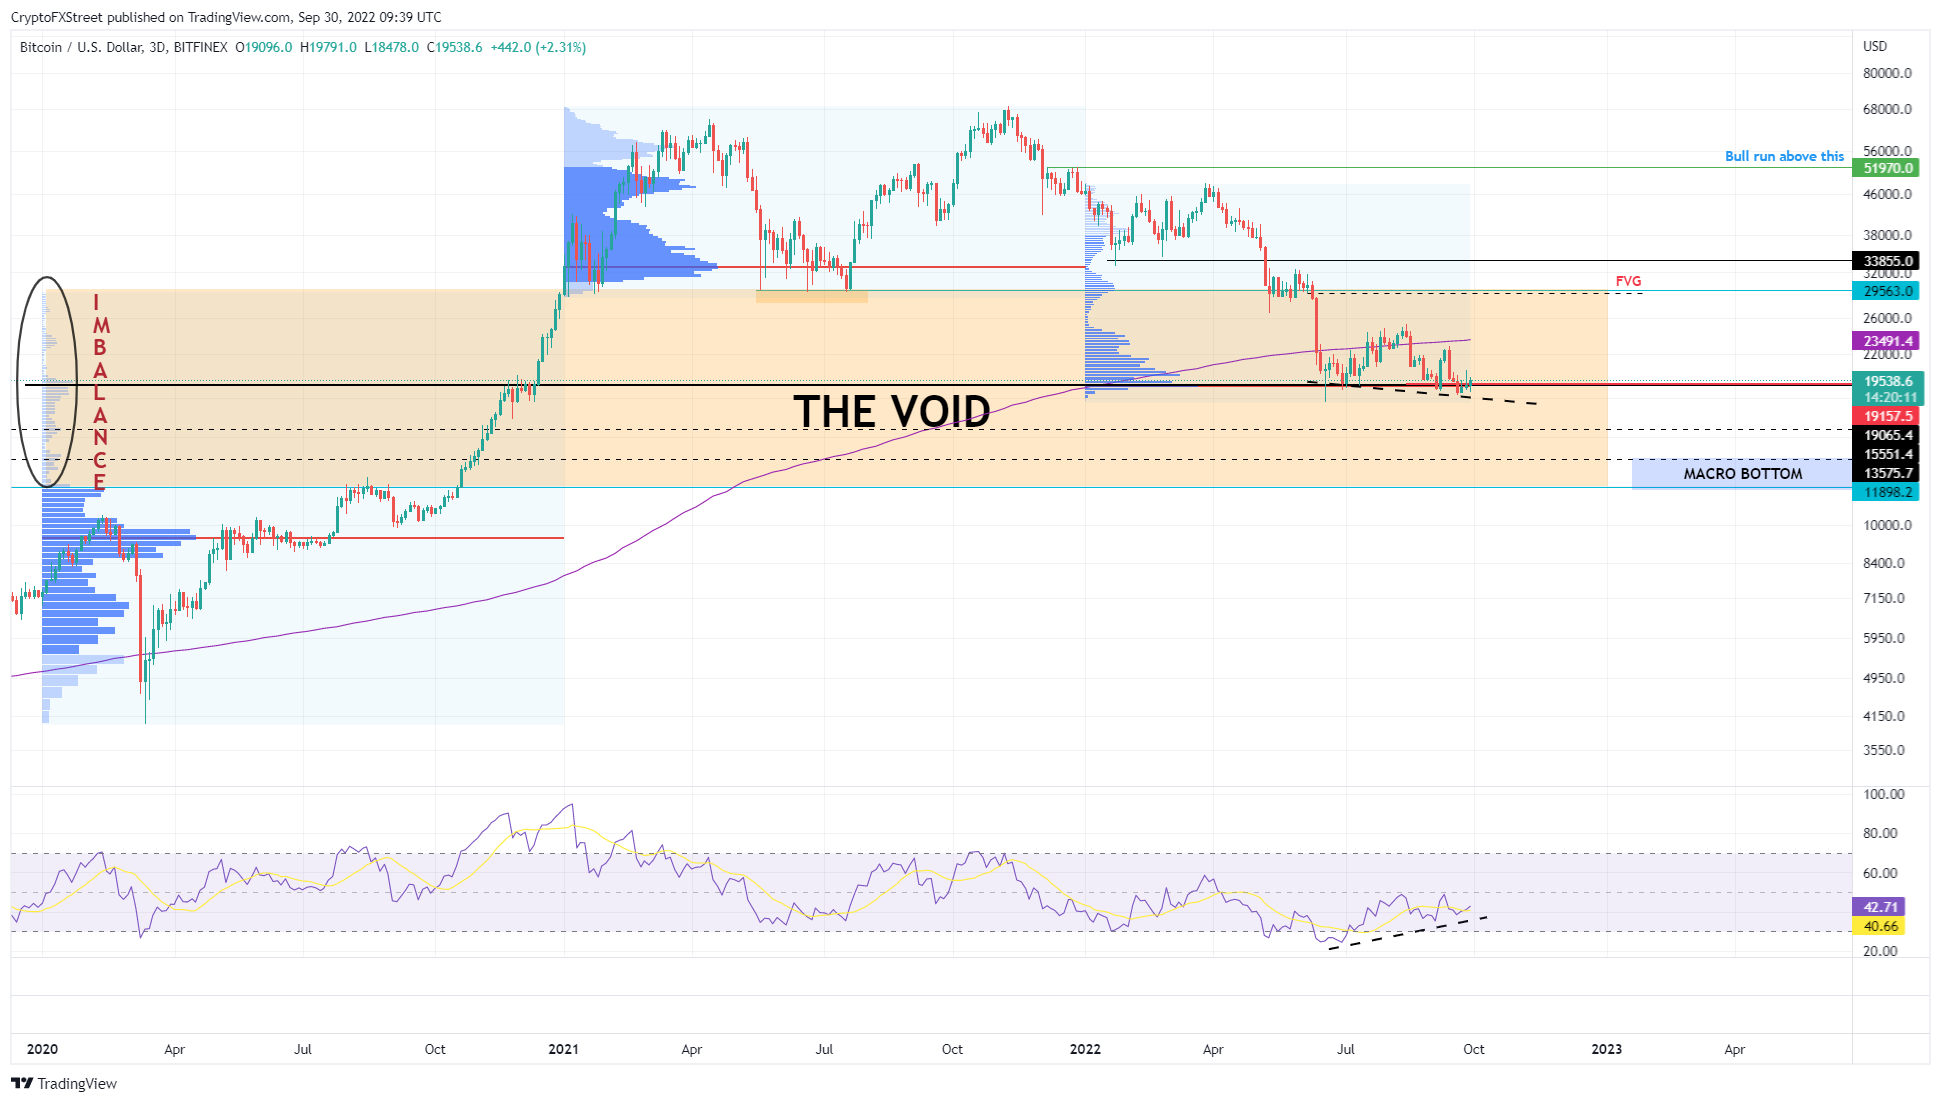
BTC/USDT 3-day chart
Assessing other outlooks using the quarterly BTC chart
While the three-day chart for Bitcoin price shows signs of bullishness, the quarterly chart less so. Instead, it reveals two important barriers:
- A resistance area, from $27,734 to $29,296.
- A support block from $13,880 to $19,666.
From a macro outlook, the support block has been extremely helpful in assisting buyers and absorbing the incoming selling pressure. Therefore, the possibility of a bounce from the current position to $29,296 makes logical sense and also aligns with the narrative detailed above.
Furthermore, a flip of the resistance area could allow Bitcoin price to extend its gain from 48% to 68% as it retests the Fair Value Gap (FVG), aka imbalance, at $32,950.
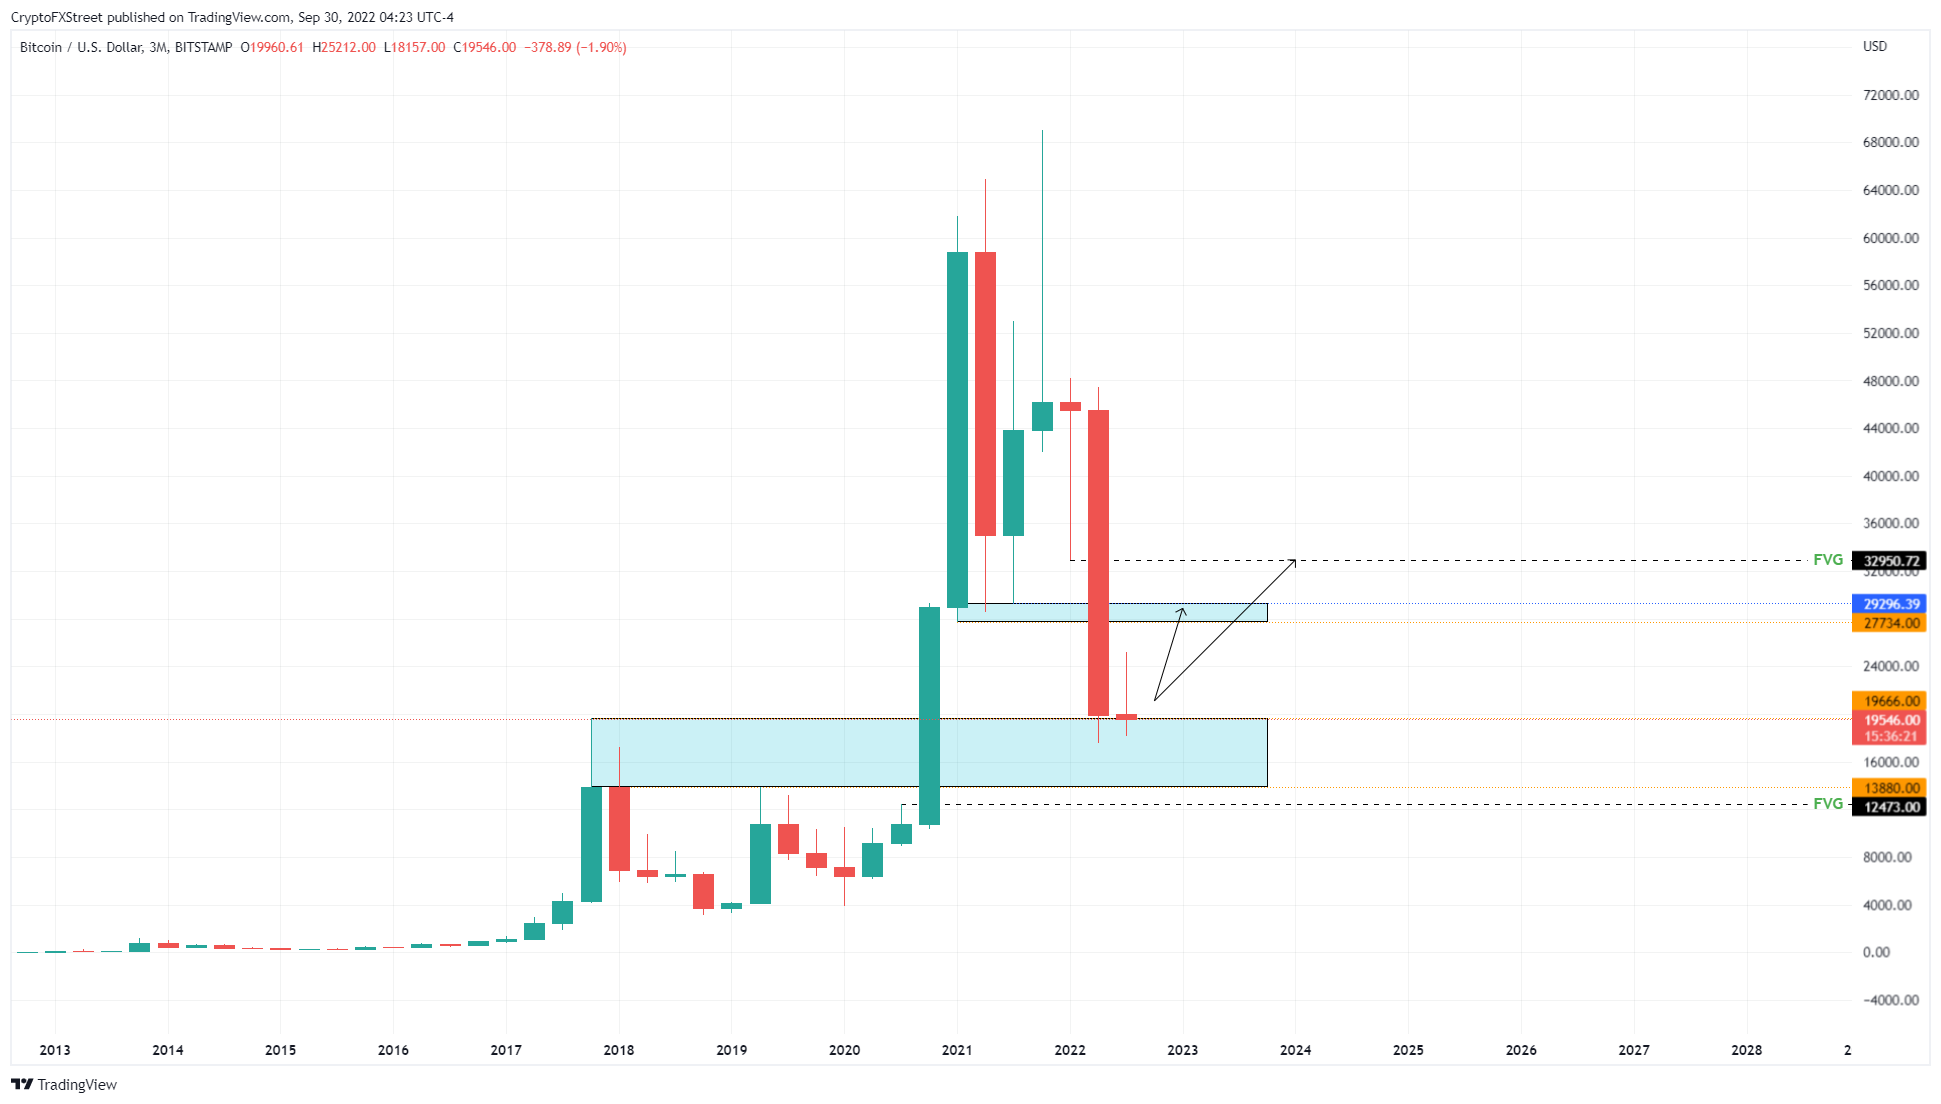
BTC/USD 3-month chart
Although the fact today is the last day of 2022’s third quarter adds plausibility to the bullish outlook, there is likely to be massive volatility, which could push Bitcoin price in either direction, and it may be advisable to avoid trading until the quarterly close.
Investors should also consider the possibility of a market manipulation that pushes Bitcoin price to sweep June’s low at $17,593.
On the other hand, if sellers take control and push Bitcoin price to produce a three-day candlestick close below the September 19 swing low at $18,210, it would invalidate the bullish divergence and thesis outlined above.
In such a case, market participants should consider the possibility of digging deeper into the $13,880 to $19,666 support box. This move could knock Bitcoin price to retest intermediate support at $15,550
Author

Akash Girimath
FXStreet
Akash Girimath is a Mechanical Engineer interested in the chaos of the financial markets. Trying to make sense of this convoluted yet fascinating space, he switched his engineering job to become a crypto reporter and analyst.


