Bitcoin Weekly Forecast: BTC/USD is haunted by the range, bears are growing stronger
- Bitcoin ventured a rally outside the range but bulls failed to snatch the initiative.
- BTC is more correlated with the US stocks than with gold.
- The range-bound trading may dominate during the next week.

Bitcoin attempted a rally in the middle of the week, but the effort was so feeble, that the price couldn't even touch $9,500. At the time of writing, BTC/USD is changing hands at $9,179, mostly unchanged from Friday on the previous week. Notably, some mid-cap and small-cap altcoins staged a spectacular rally. For example, Dogecoin (DOGE) jumped by over 60% on a week-on-week basis and hit $0.005335 after a viral video on TikTok challenged users to buy the coin. VeChain, Stellar, Cosmos and Cardano also showed strong gains.
Bitcoin's market capitalization reached $169 billion, while an average daily trading volume is over $17 billion. Bitcoin's market dominance settled at 62.9%. Over 72% of Bitcoin holders are making money at the current price, and only 21.2% of them are in red. A cluster of over 1.3 million addresses holding over nearly 800,000 BTC has a breakeven point in the range from $9,350 to $9,550. No wonder that BTC bulls have a hard time pushing the price above this area.
Bye-bye, volatility
According to the recent research performed by the cryptocurrency exchange Kraken, Bitcoin’s annualized volatility dropped from 78% in the first month of June to 51%, which is the lowest level in the recent six months. While some analysts say that the declining volatility signals that Bitcoin is becoming more mature, traders are a bit exhausted by the directionless market locked in a tight range for over a month now. Meanwhile, the 30-day volatility is the lowest since March 2019 at 25.5%.
Low volatility is closely related to trading volumes that have been sliding down and hit the 4-month low of $36.6 billion in June.
Bitcoin correlations
The first cryptocurrency is now more correlated to the US stock market than Gold, which means it behaves like a risk asset and tends to decline amid flight to safety. Kraken experts found out that Bitcoin's 30-day correlation to S&P 500 climbed to 0.56 late-June and ended the month above the 1- year average. Meanwhile, correlation with gold dropped below its 1-year average of 0.24 to a near 4-month low of -0.49.
In this context Bitcoin traders keep an eye on stock market fear indicator dubbed “VIX”, which measures S&P 500’s 30-day forward-looking volatility and reflects investors’ fears and risk tolerance. Obviously, Bitcoin bulls will have a hard time pushing the price higher amid growing risk aversion and concerns related to the second wave of COVID-19 and economic recovery.
BTC/USD: Technical picture
On a weekly chart, Bitcoin (BTC) has printed the first green candle in more than a month, which may signal that the reversal is just around the corner. However, we will need to see a sustainable move above $10,000 fo the recovery to gain traction. The next vital resistance comes at $10,400, which is the highest level of June. Meanwhile, the market stays lethargic and waits for strong triggers that will help the price to find the direction.
The critical support is still created by weekly SMA50 currently at $8,660. This technical level has served as a backstop for Bitcoin bears since the beginning of May and now it coincides with the lower line fo the consolidation channel. The MA stays flat, which means the market may continue moving sideways; however, as long as the price stays above this level, the chances are that BTC will break from the current range to the upside.
Once the above-said support level is broken, the sell-off may be extended towards $8,300 (the middle line of the weekly Bollinger Band and psychological $8,000. Another formidable support is created by weekly SMA100 on approach to $7,300. A sustainable move below this area will negate the long-term bullish potential.
BTC/USD weekly chart
-637299929074884855.png)
The daily chart reflects the range-bound nature of Bitcoin's movements with the initial resistace created by the daily SMA50 at $9,370. It is followed by the upper line of the daily Bollinger Band located above $9,500. BTC/USD has been trading below this MA for over three weeks now. The local support is created by the psychological $9,000 with the lower line of the daily BB located below this area. Once it is out of the way, the sell-off is likely to gain traction with the next focus daily SMA100 at $8,700 and the above-mentioned weekly SMA50 at $8,650.
BTC/USD daily chart
-637299929338169524.png)
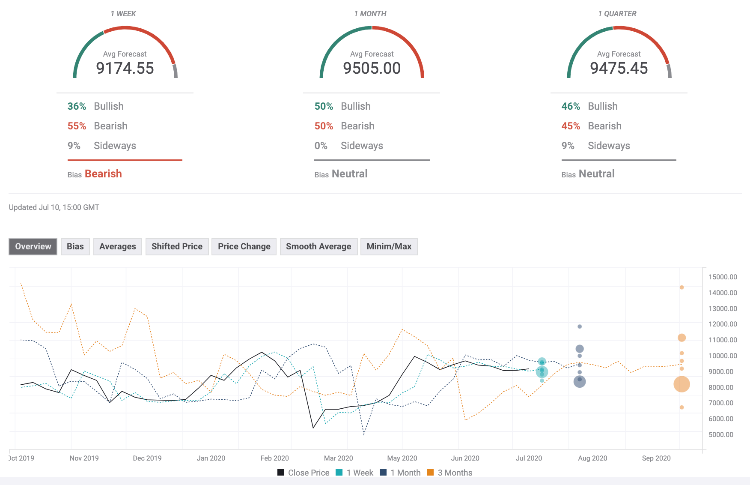
The Forecast Poll has worsened since the previous week. The market sentiments are mostly neutral on a monthly and quarterly basis and bearish on a weekly basis. It means that the forecasters do not expect a bullish breakthrough in the nearest future. The expected price is below $10,000 mostly unchanged from the previous week on all time frames.
Author

Tanya Abrosimova
Independent Analyst


