Bitcoin Weekly Forecast: BTC eyes $53,000, but indicators suggest otherwise
- Bitcoin price shows an ascending triangle formation, hinting at a breakout to $53,629.
- Transaction data suggests this move is likely, but market indicators suggest otherwise.
- A daily candlestick close below the $34,752 support level will invalidate the bullish thesis.

Bitcoin price consolidation continues with the formation of a bullish setup. A breakout from this formation could be the key to triggering a bull run, but things are not as simple as they appear. On-chain metrics and market indicators suggest that the bullish thesis has more than meets the eye.
Bitcoin price and its dilemma
Bitcoin price set up three equal highs and four higher lows since January 22. These swing points can be connected using trend lines to form an ascending triangle. This technical formation forecasts a 21% ascent, obtained by adding the distance between the first swing high and low to the breakout point at $44,418.
A decisive close above the horizontal resistance barrier at $44,418 will mark a breach of the said pattern and trigger a 21% move to $53,629. Interestingly, a daily candlestick close above $52,000 will create a higher high and suggest the start of a bull rally.
In such a situation, Bitcoin price will likely set up a higher low and make a run for the $60,000 psychological level and perhaps the all-time high at $69,000 if bullish momentum sustains.
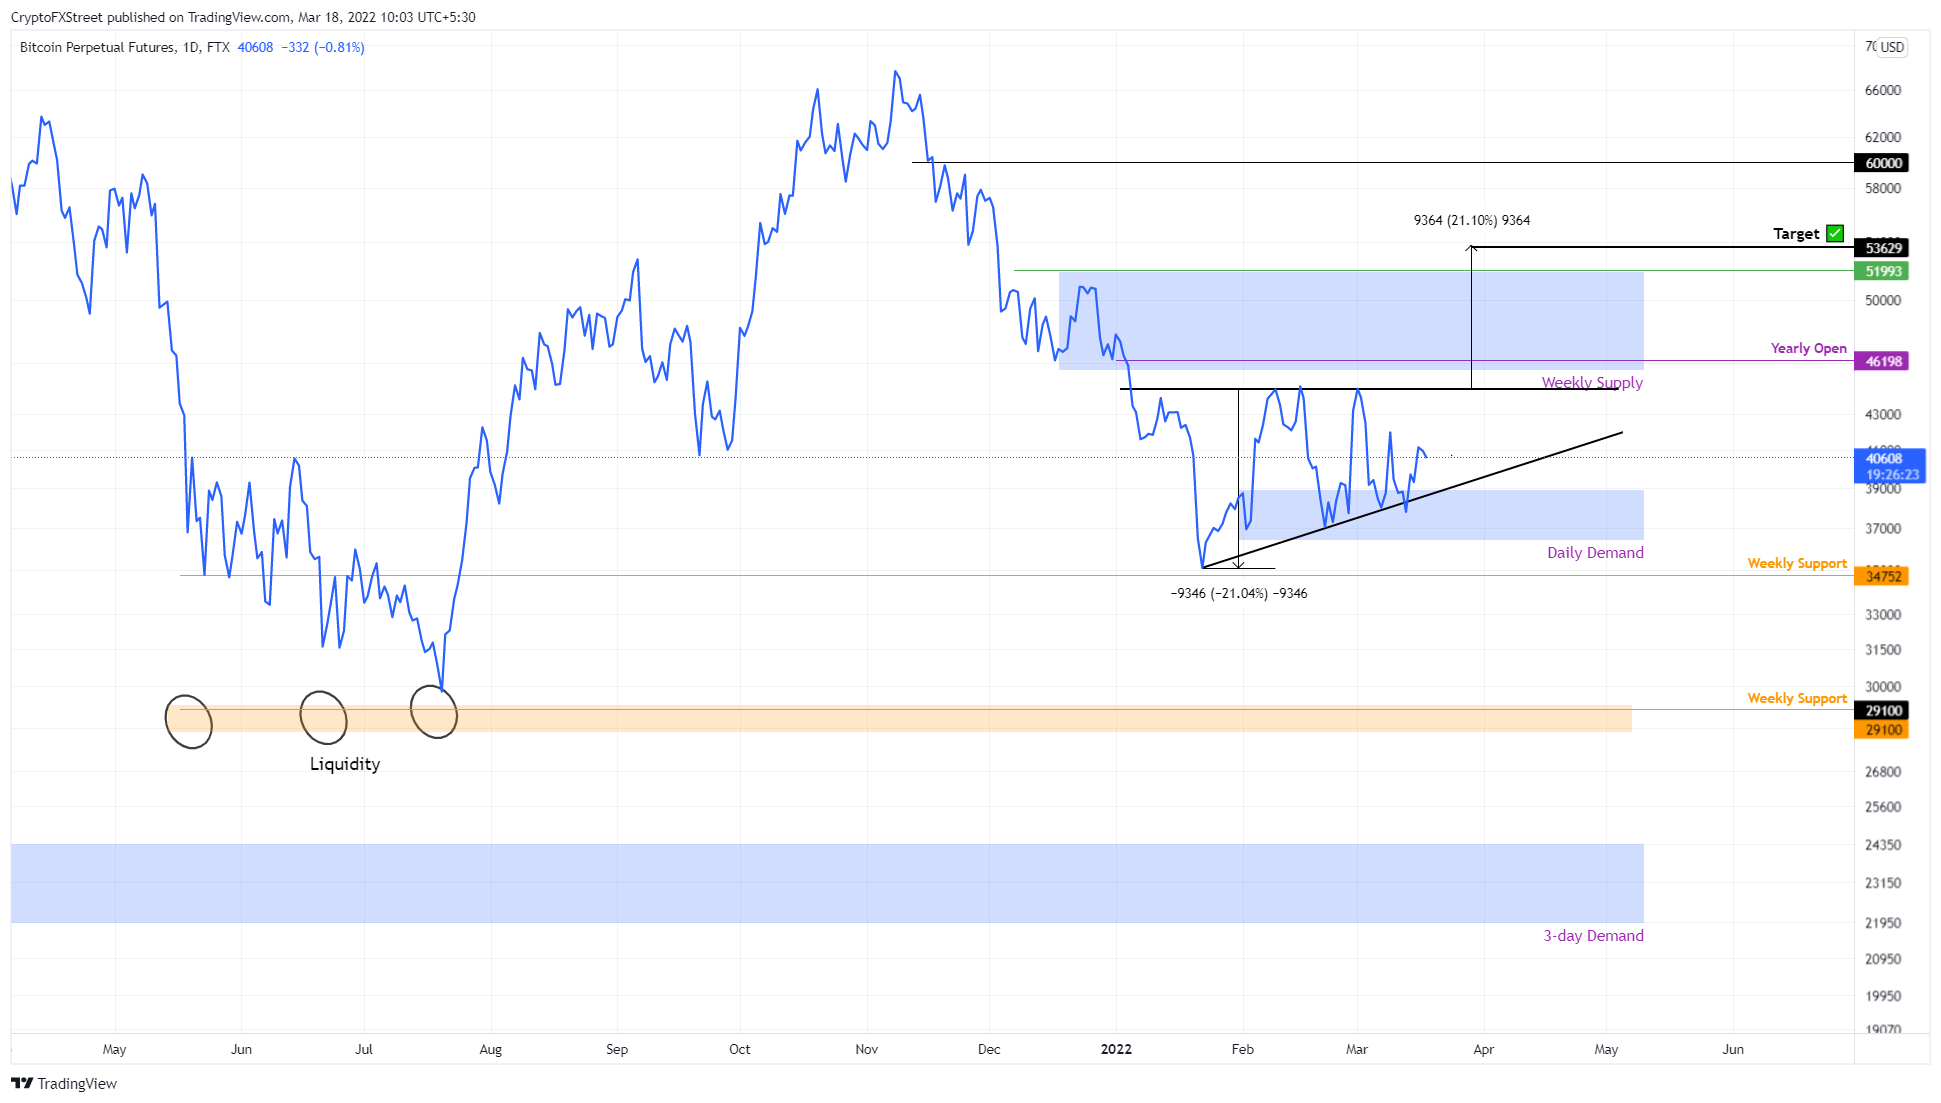
BTC/USDT 1-day chart
Supporting this move higher is IntoTheBlock’s Global In/Out of the Money (GIOM) model. This index shows that the immediate resistance area, extending from $41,600 to $43,750, is weak and that a move to $47,642 is likely.
Here, roughly 6.03 million addresses that purchased nearly 3.2 million BTC are “Out of the Money.” Therefore, a move into this area is likely to be met with selling pressure from investors trying to break even.
Unlike the technicals, the transaction data suggests the possibility of a bullish move, but this outlook seems capped at $50,000.
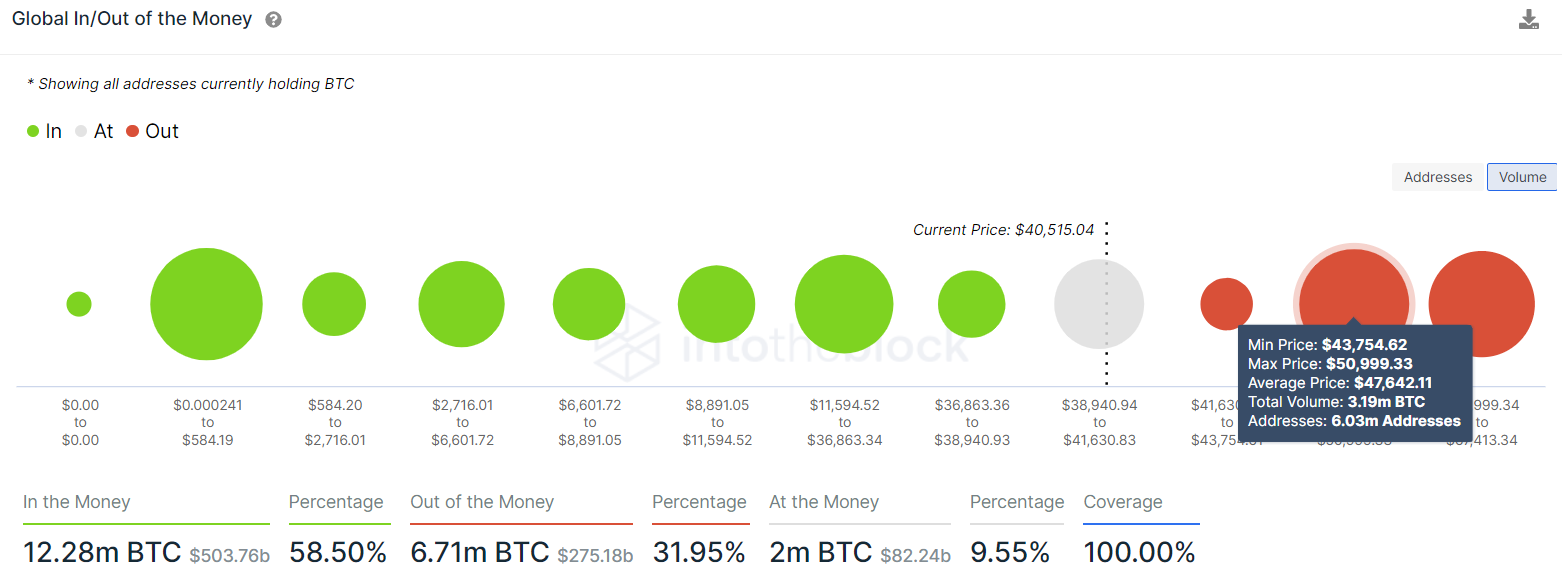
BTC GIOM
Giving bulls hope is the exchange net position change indicator, which is currently in the red, suggesting a net outflow of BTCs. Roughly 36,600 BTCs left centralized entities on March 11 and 13,000 on March 16.
While the netflow has turned slightly positive today, the massive outflows over the past week suggest that institutional or high networth investors are bullish and are moving their holdings to cold wallets in anticipation of a rally.
-637831757840996129.png)
BTC exchange position change
The bullish side of things looks neat and supports the possibility of a Bitcoin price rally higher. However, the Open Interest (OI) chart does not conform to an optimistic outlook. The OI has hovered between 12.5 billion and 9.6 billion since January 12. In recent times, this number has dropped to 11 billion and has been on a downtrend since November 8, 2021, suggesting a lack of participation from whales.
It would have signaled a bullish outlook if the OI had spiked up while the price remained lull. However, due to the lack of increase, the possibility of an up move remains subdued.
-637831758110130117.png)
BTC open interest
Supporting this outlook is the estimated leverage ratio for Bitcoin price. A high ratio indicates that many investors are trading with an absurd amount of leverage. Such market conditions do not support a bullish move. Often a tiny spike against the direction of these traders will likely result in massive liquidations, resetting the landscape and allowing smart money to position themselves long.
Therefore, futures traders need to keep a close eye on this chart since it indicates the possibility of a capitulation move. Additionally, this indicator has always crashed before a full-blown reversal; the March 2020 and September 2021 crashes are great examples.
Moreover, the estimated leverage ratio hit a new all-time high of 0.218 on March 15, further depicting how tightly the market is wound.
-637831758247638870.png)
BTC estimated leverage ratio
With the suppositions from on-chain and market indicators, a bearish scenario would include Bitcoin price shattering the hypotenuse of the ascending triangle, invalidating it and heading lower to retest the $34,752 weekly support level.
Here, buyers have another attempt to trigger a run-up; however, a daily candlestick close below it would create a lower low and invalidate the bullish thesis. In this scenario, BTC could crash to $30,000 or below $29,100 to collect the sell-side liquidity resting below it.
Author

Akash Girimath
FXStreet
Akash Girimath is a Mechanical Engineer interested in the chaos of the financial markets. Trying to make sense of this convoluted yet fascinating space, he switched his engineering job to become a crypto reporter and analyst.


