Bitcoin Weekly Forecast: BTC bulls brace for another roller-coaster week as the worst is not over
- Bitcoin stopped short of the all-time high and dropped below $17,000 amid profit-taking.
- Several fundamental triggers might have served as a trigger for the downside correction.
- Bitcoin may extend the decline despite positive long-term perspectives.

Bitcoin has lived through a roller-coaster week. The pioneer digital currency hit another multi-year high of $19,500 and got really close to the all-time high on Wednesday. The cryptocurrency world held its breath in anticipation of a new record, but the market fell short of meeting the hopes and aspirations. At the time of writing, BTC/USD is changing hands at $17,000, mostly unchanged on a day-to-day basis and down nearly 3% week-to-week.
Since the start of November, the BTC price has increased by nearly $3,500. Even despite the retreat, November 2020 may enter Bitcoin's history as one of the strongest bullish months.
Leveraged traders play added fuel to the flame
BTC dropped from $19,500 to $16,200 within hours on Thursday as profit-taking on approach to the all-time high triggered massive liquidations of overleveraged longs in derivatives on large cryptocurrency exchanges.
According to ByBit, nearly $2 billion were wiped away within a few hours once the correction started.
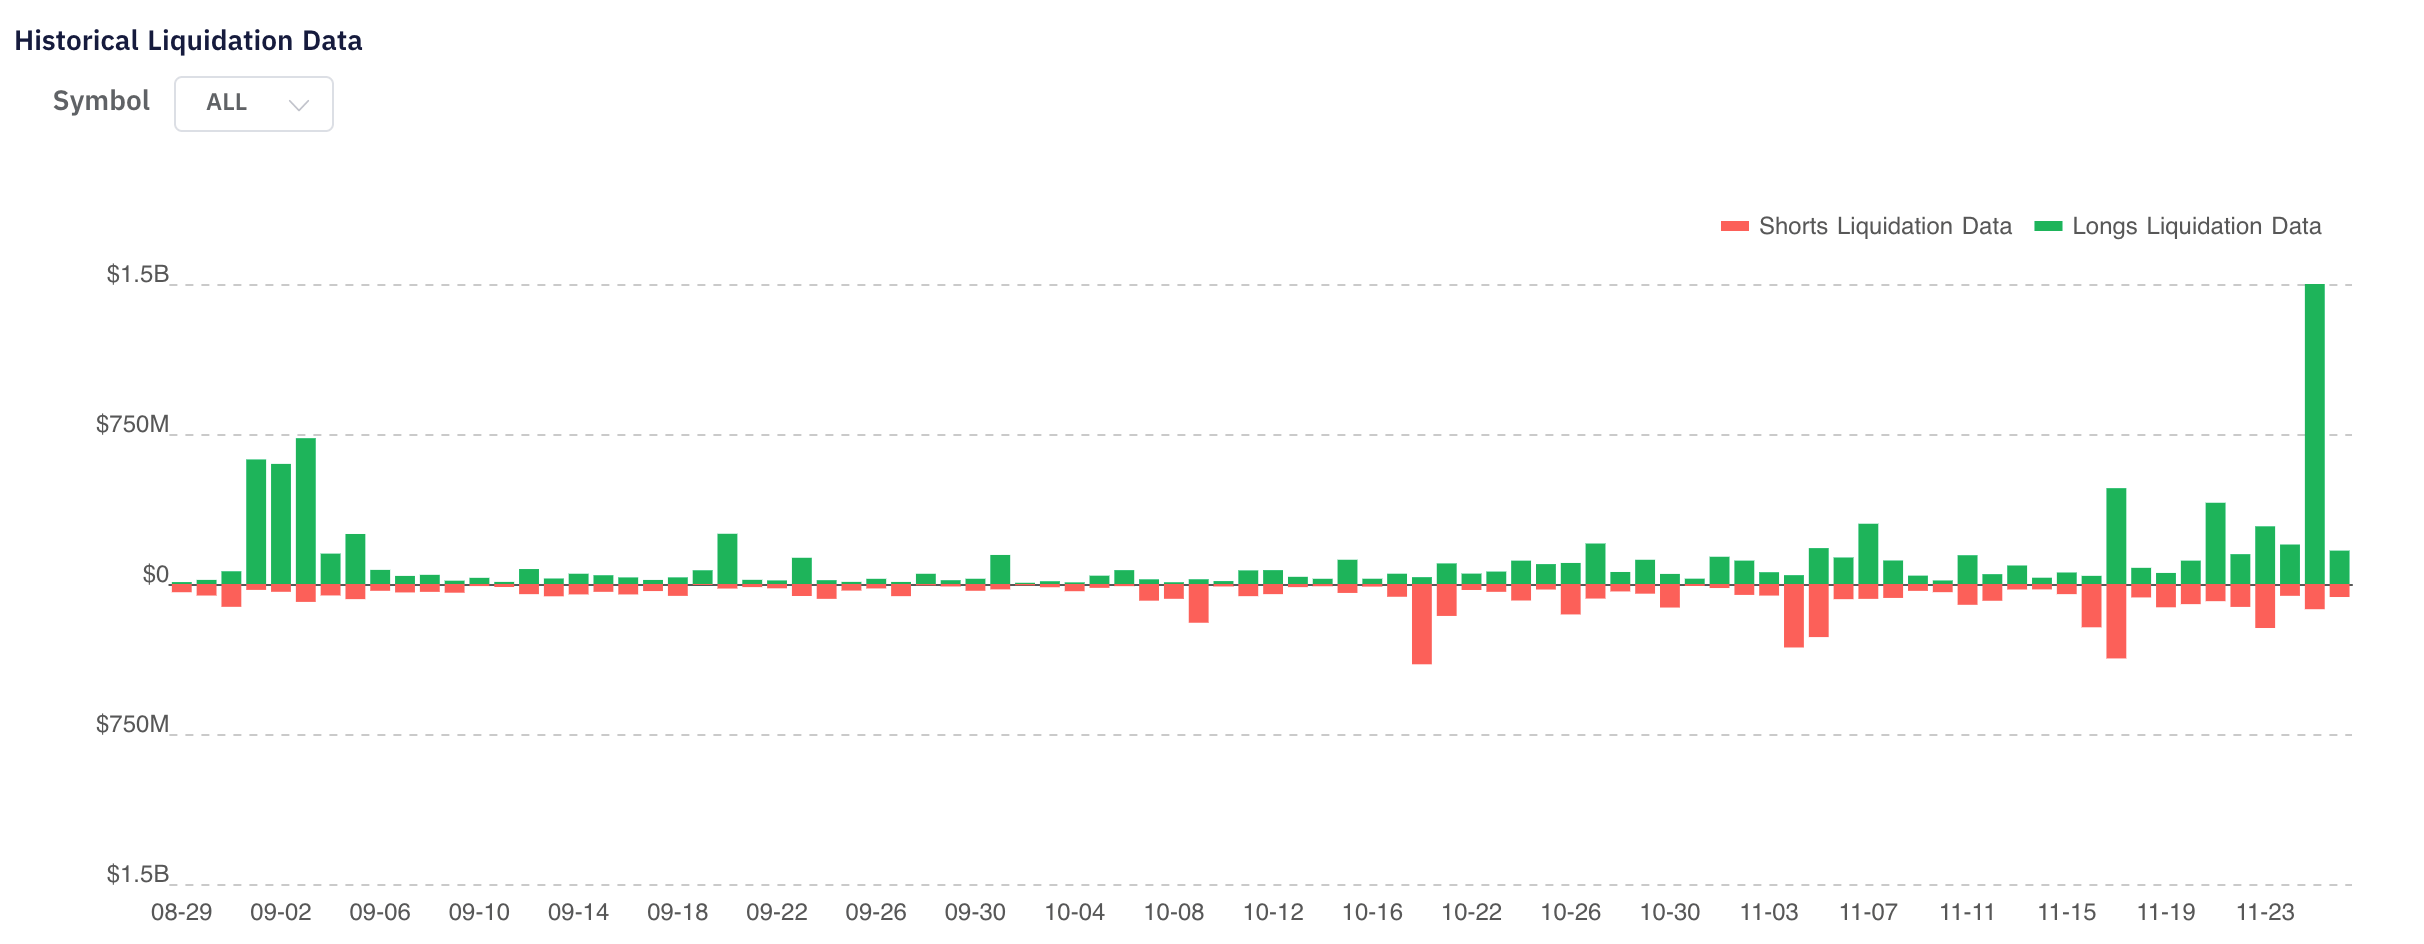
Historical data on leveraged positions liquidation
Long positions became too costly for the marginal traders as the funding rate rose to a multi-month high of 0.098% in the past few days amid a sharp price increase. The funding rate is the cost marginal traders have to pay for holding long positions in the perpetual futures market. It is decided and paid every eight hours. After the BTC price heavy downward correction, it dropped to 0.02%.
Traders found reasons to book profit
The financial markets are sentiment-driven in most cases. In some periods, traders see their glass half-full and they filter only positive news, driving the prices to new highs. At other times they refocus on negative information and the trend changes.
That's what happened this week. The bearish fundamental factors started to pile up and reached a critical mass, triggering a correction. Below are a few factors that might have forced traders to begin taking profit ahead of a historical record.
OKEx traders exacerbated the market crash
The Chinese cryptocurrency exchange resumed withdrawals on November 26. The traders of the platform had to wait for over a month before they regained access to their assets. Naturally, this even caused a massive BTC outflow from OKEx. As Bitcoin had already started trading down by that time, some of the traders rushed to cash out on their assets, increasing the selling pressure.
This development did not come as a surprise. As FXStreet had previously reported, cryptocurrency industry experts warned about potential spikes of market volatility amid massive withdrawal requests on OKEx.
Outgoing Trump administration prepares a nasty surprise
The US Treasury Secretary may be preparing legislation that will directly affect the cryptocurrency holders. The head of the largest US-based cryptocurrency exchange, Brian Armstrong, noted that the Trump administration might require financial institutions to verify the owners of self-hosted digital assets wallets.
He wrote in his Twitter account:
This sounds like a reasonable idea on the surface. Still, it is a bad idea in practice because it is often impractical to collect identifying information on a recipient in the crypto economy.
Armstrong believes that this move might undermine numerous use cases for digital assets and drive the industry towards unregulated platforms. Read more details here.
Technical indicators imply that the worst is not over
Meanwhile, on-chain data implies that BTC may face stiff resistance on approach to $18,000. IntoTheBlock's "In/Out of the Money Around Price" model suggests that nearly 700,000 addresses previously purchased over 500,000 BTC between $17,500 and $18,000. Notably, this supply wall goes all the way up to $19,000. Only a sustainable move above this area will invalidate the bearish scenario and bring the bullish trend back on track.
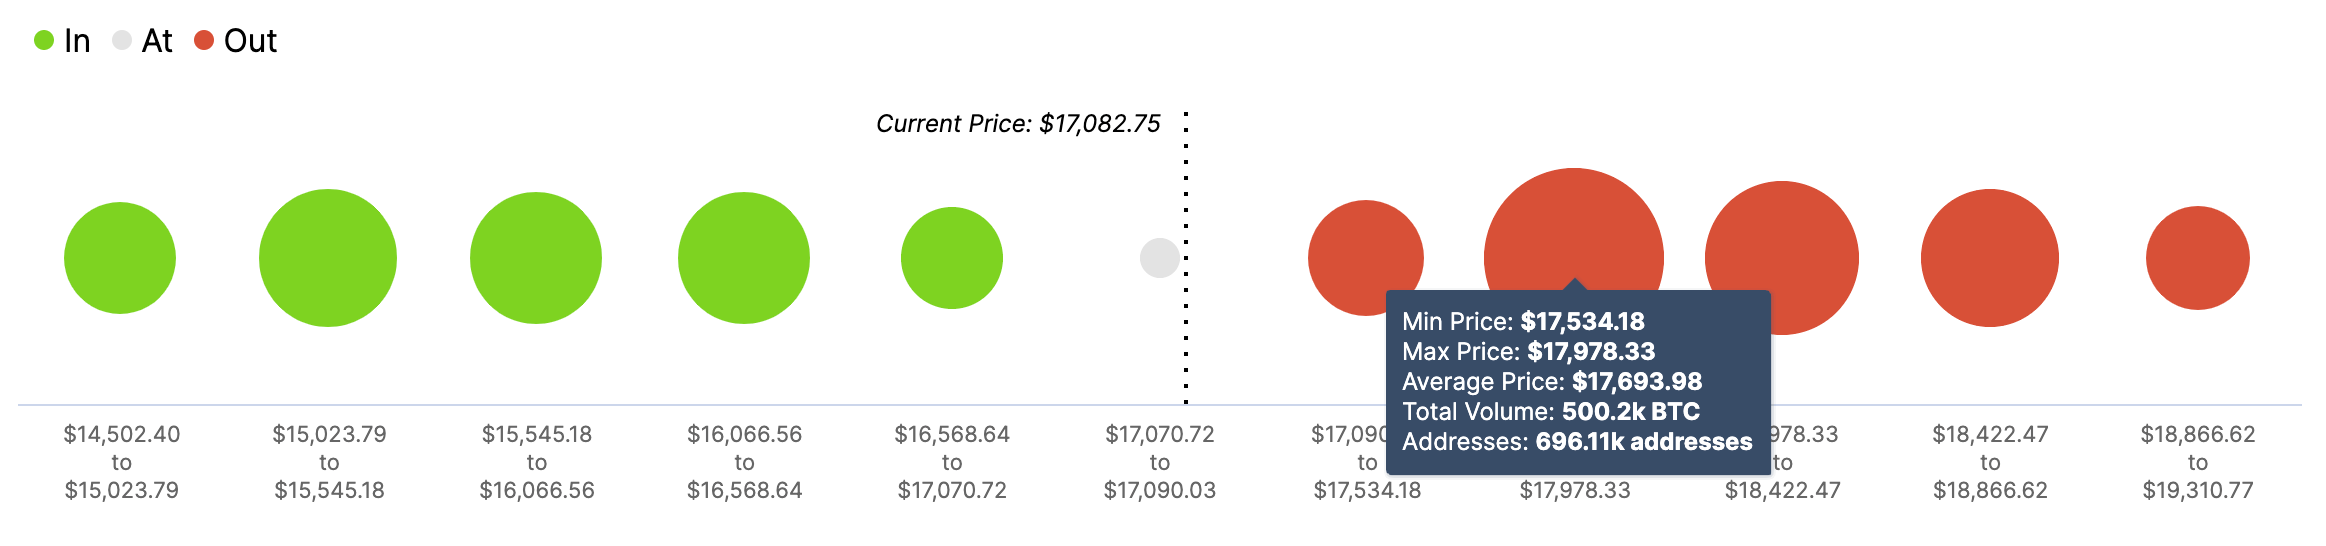
Bitcoin In/Out of the Money Around Price
On the other hand, the downside seems to be less cluttered with support areas. A minor barrier sits above the recent low reached at $16,200. If it gives way and sell orders continue to pile up, BTC may quickly retreat towards $15,000 with little support on the way.
On the long-term charts, TD Sequential indicator presented a sell signal on the weekly chart in the form of a green nine candlestick. The monthly chart also contains a green eight candlestick, which might transform into a sell signal in less than a week.
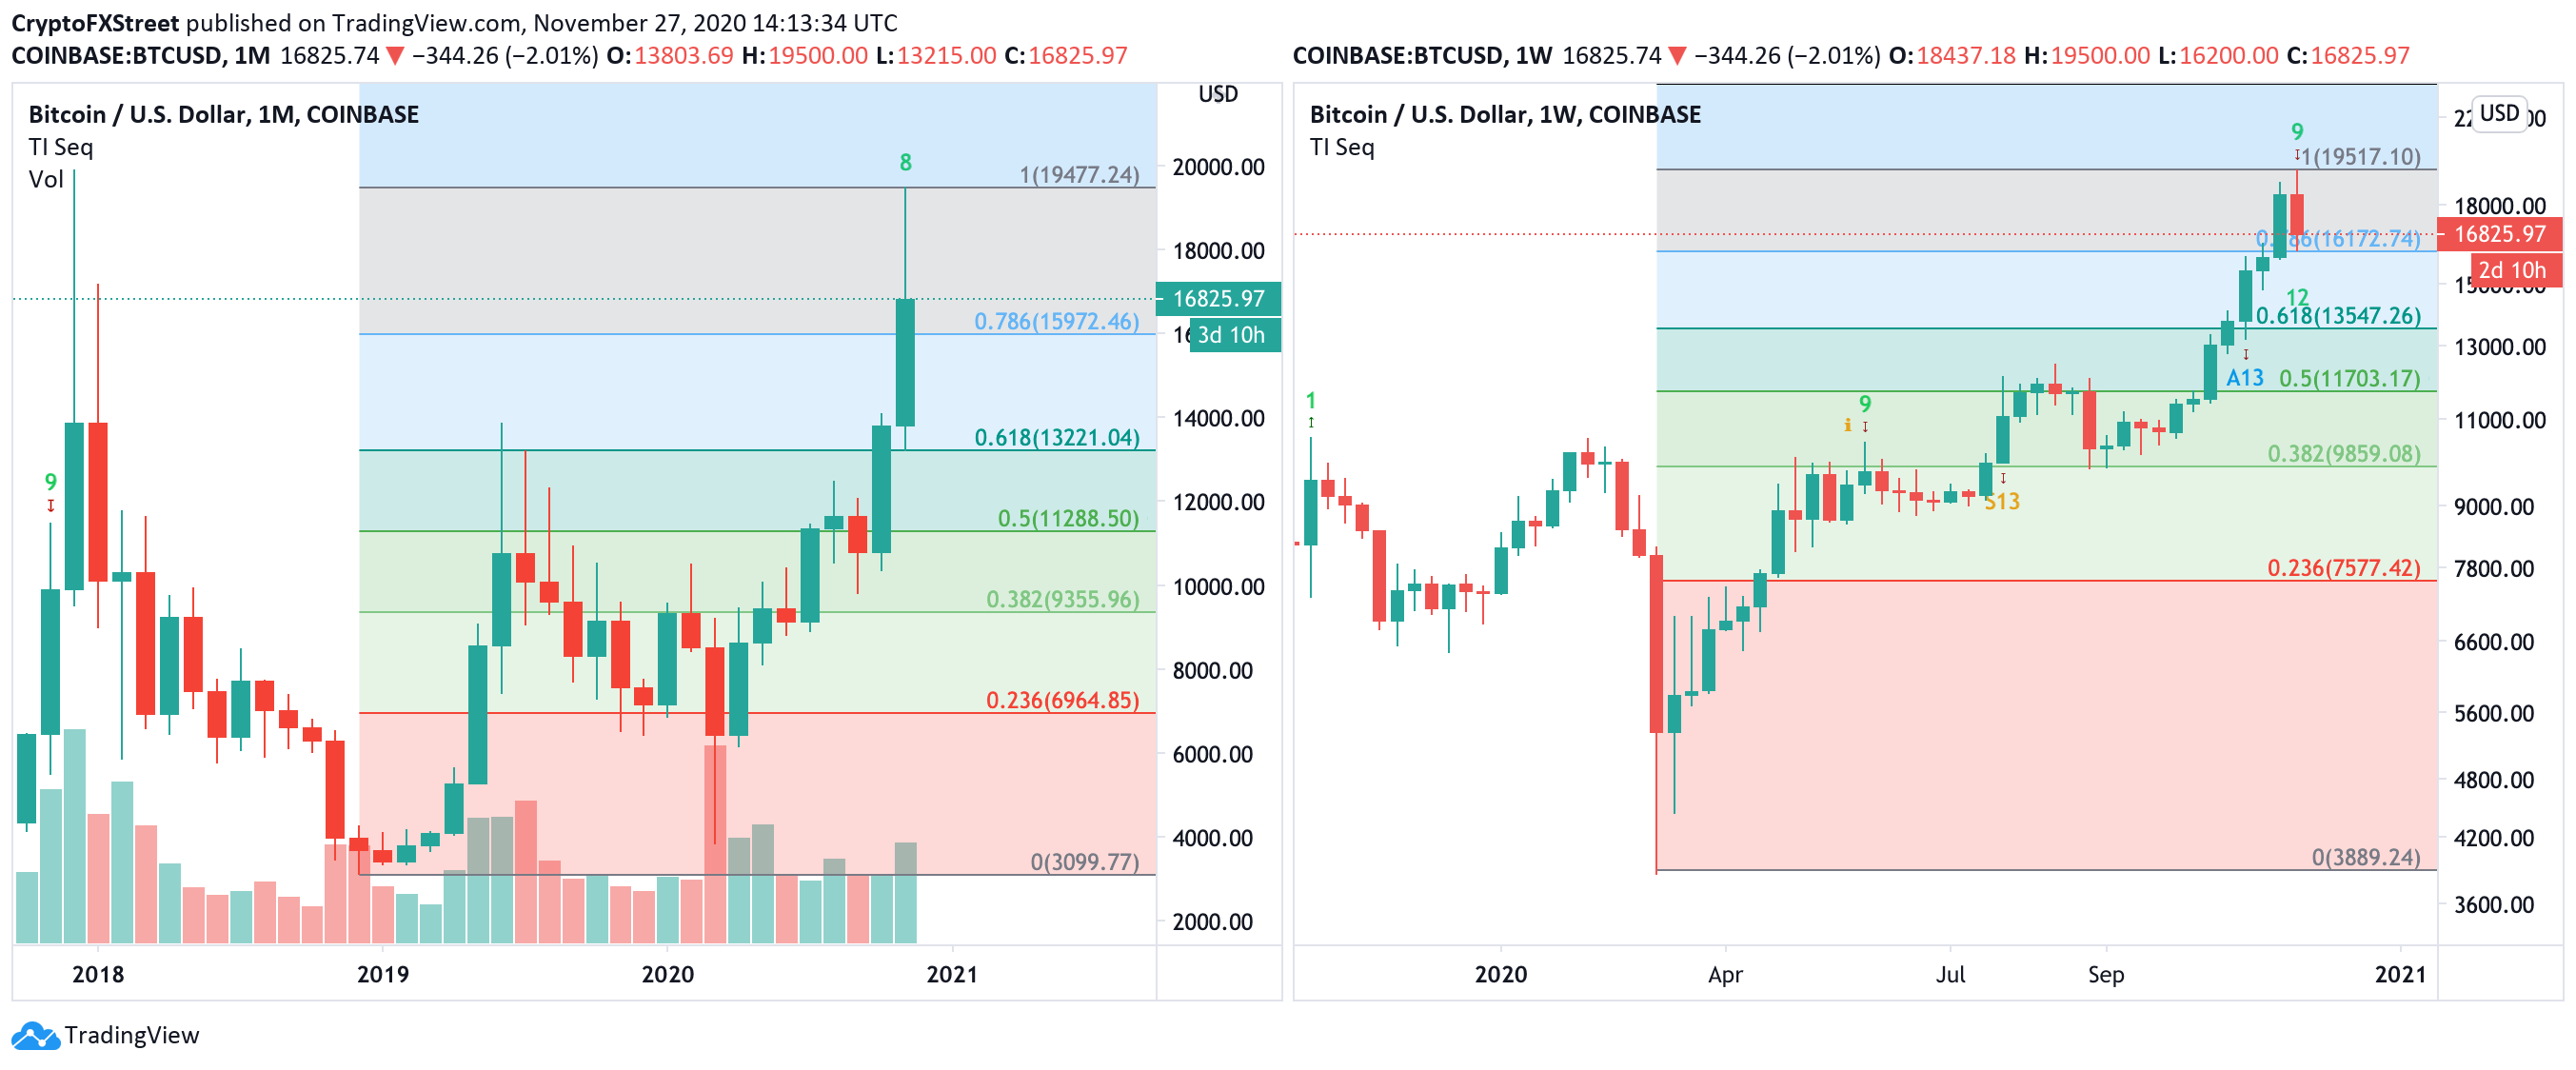
BTC/USD, weekly and monthly charts
If these bearish signals are confirmed, the first target on a weekly chart comes at $13,500, which is 61.8% Fibo for the upside move from March 2020 low to the recent high. It is followed by $13,200 – 61.8% Fibo retracement for the upside move starting in December 2018, visible on the monthly chart.
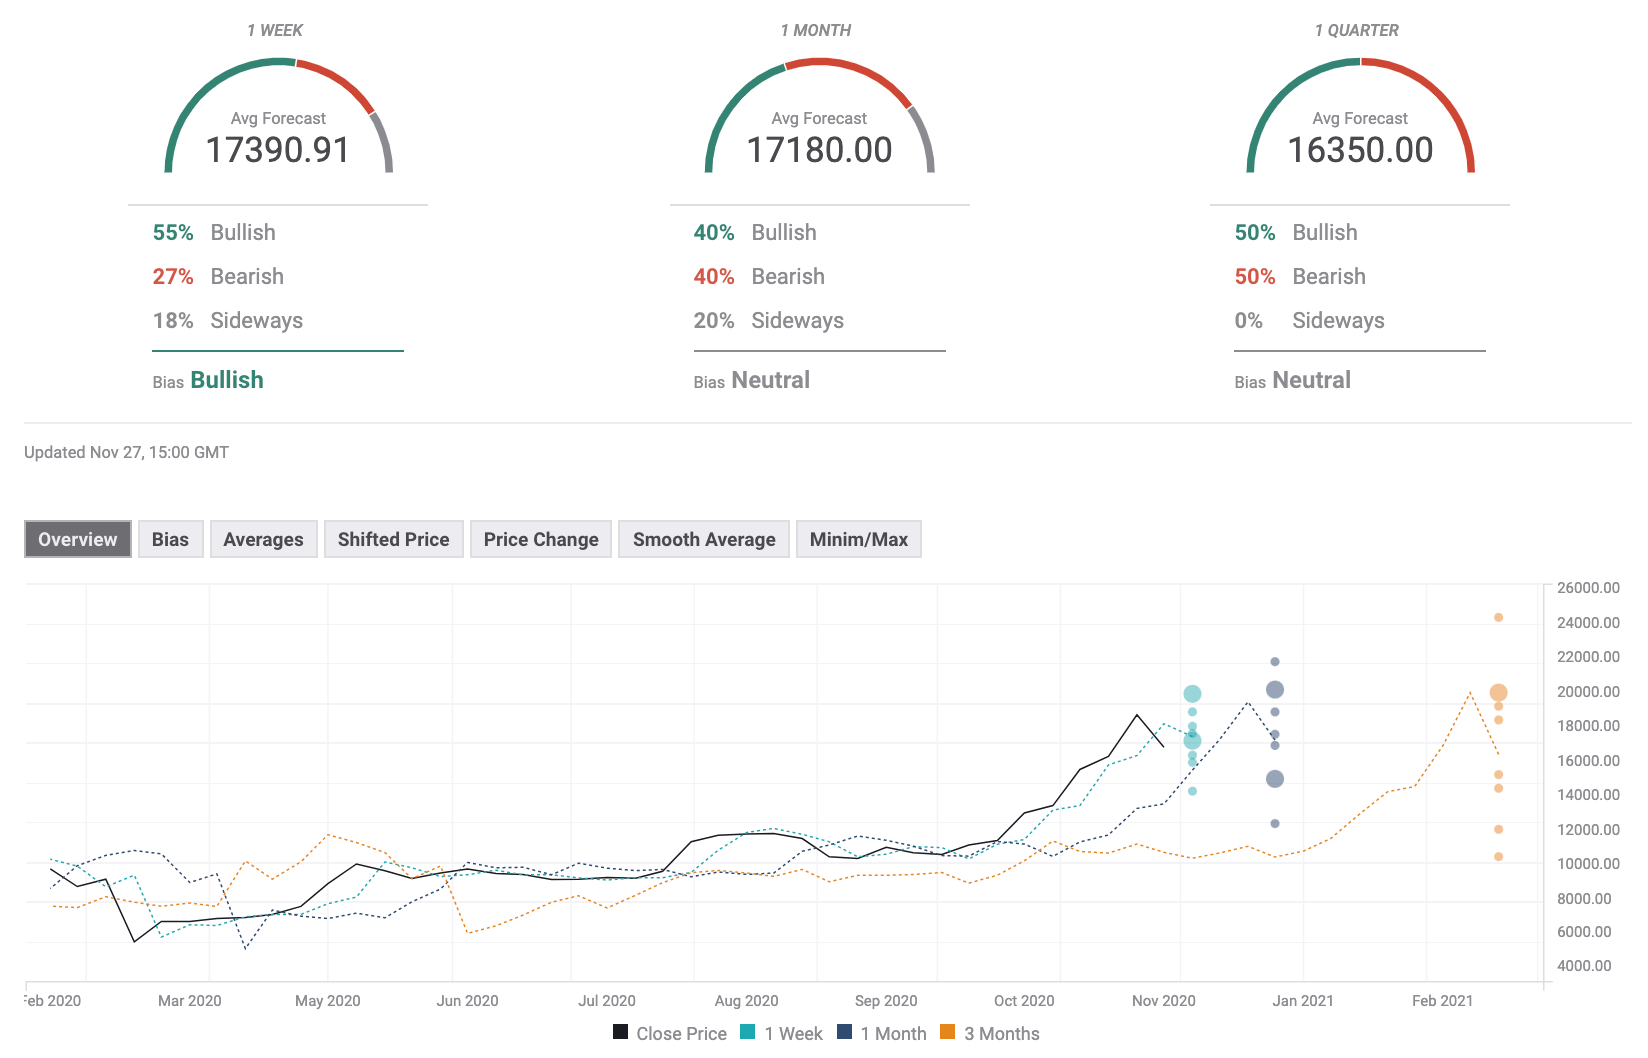
Bitcoin's poll of experts
FXStreet's Bitcoin Forecast Poll worsened slightly from the previous week as the expectations on the monthly and quarterly timeframes turned neutral. The experts stay bullish only on a weekly basis. Notably, the price predictions imply that average participants bet on Bitcoin's decline below $17,000 on a quarterly basis.
Author

Tanya Abrosimova
Independent Analyst




