Bitcoin Technical Analysis: BTC/USD bulls make a comeback as difficulty reaches all-time high
- BTC/USD has crossed the $10,300 level.
- Bitcoin’s difficulty has reached 17.558 tera hashes, which is an all-time high.

BTC/USD daily chart
-637347791188901781.png)
BTC/USD bulls stepped up big time following two heavily bearish days. The price has gone up from $10,169.70 to $10,300. As per the daily price chart, we have four strong resistance levels at $10,935.70, $11,098.82 (SMA 50), $11,330.62 and $11,536.50. On the downside, we have two healthy support levels at $10,171.60 and $9,613.55. The Elliott Oscillator has had three consecutive red sessions, which means that the overall market sentiment is still bearish.
BTC/USD 4-hour chart
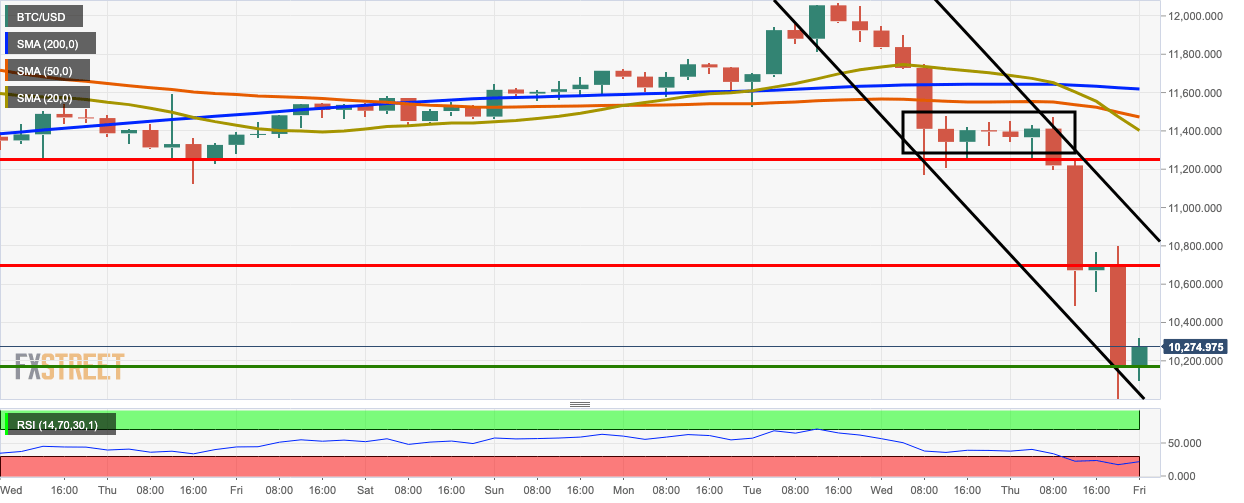
The BTC/USD 4-hour chart is trending in a downward channel formation. The price has dropped from $11,412.60 to $10,314.50 in the last five sessions. The 4-hour chart has strong resistance at $11,618.24 (SMA 200), $11,472,16 (SMA 50), $11,407.35 (SMA 20), $11,245 and $10,698.45. On the downside, we have one healthy support at $10,173.65.
Bitcoin Difficulty and Hashrate

Bitcoin’s difficulty has reached 17.558 tera hashes, which is an all-time high. Difficulty is a metric that controls the “easiness” of mining for miners. It automatically increases when mining gets easier and vice-versa. This step was taken to ensure that the production of bitcoin blocks is consistent.
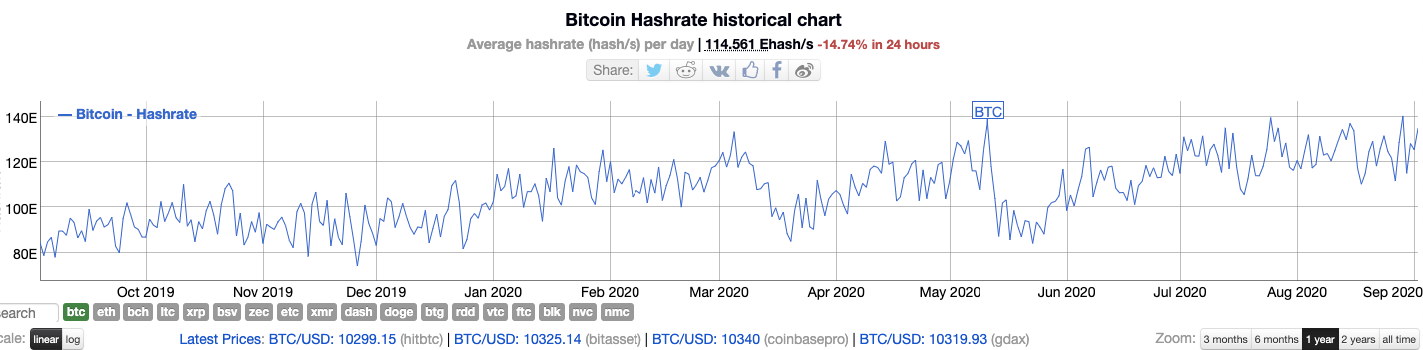
Hashrate is the overall computational power of the network. The more the hashrate, the faster the network. To ensure consistent production, the hashrate usually increases in conjunction with the difficulty.
Usually, hashrate and difficulty are inversely proportional to mining profitability, since increasing the hashrate requires miners to invest in more expensive equipment. The final chart we want you to look at is the mining profitability curve:
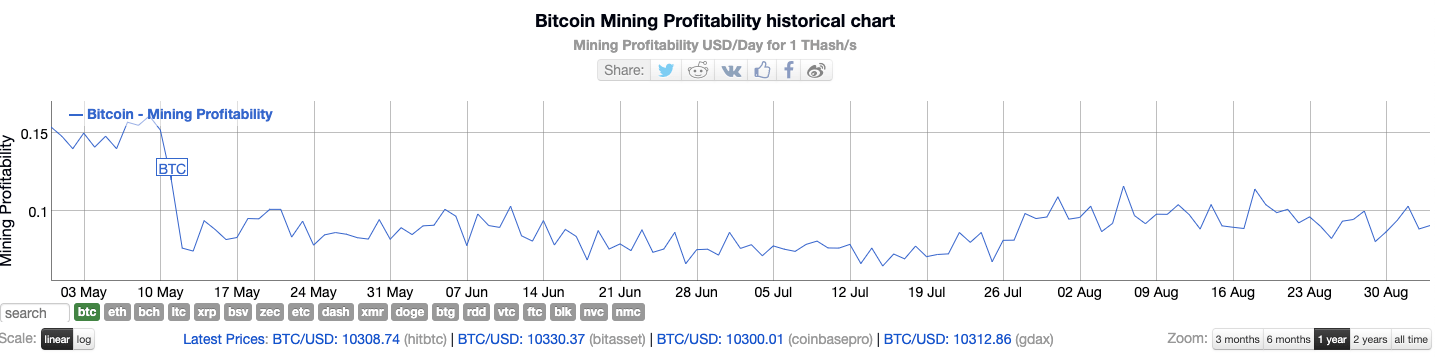
In the chart above, we can see that mining profitability took a huge tumble on 9th May 2020, and has since trended pretty much horizontally. This shows us that mining isn’t anywhere near as profitable as it should be right now.
As such, the miners have to sell their block rewards to sustain their operation instead of holding on to their coins. This can’t be healthy for the coin in the long-term.
Key levels
Author

Rajarshi Mitra
Independent Analyst
Rajarshi entered the blockchain space in 2016. He is a blockchain researcher who has worked for Blockgeeks and has done research work for several ICOs. He gets regularly invited to give talks on the blockchain technology and cryptocurrencies.


