Bitcoin, S&P 500 close in on bullish 'golden cross' signal

Bitcoin (BTC) and Wall Street's benchmark equity index, the S&P 500, are on the verge of hitting an easy-to-track bullish technical signal, the golden cross, that often makes traders giddy with delight.
A golden cross occurs when the 50-day simple moving average (SMA) of the security's price moves above its 200-day SMA, producing a cross on the price chart. Because moving averages are backward-looking indicators, the signal tells us only that the market's short-term gains have surpassed its long-term gains. Still, chart analysts and traders see it as a harbinger of higher prices over the long run.
"The winds of change have started to blow with the increasing likelihood of bullish golden crosses in the near future," analysts at Valkyrie recently noted in a newsletter, referring to the impending crossover on the daily bitcoin and S&P 500 charts.
Bitcoin will likely see its first golden cross since September 2021 in the next week or two, according to charting platform TradingView. Meanwhile, the S&P 500's averages appear on track to produce the golden cross on Thursday.
The concurrent appearance of the golden cross on bitcoin and the S&P 500 might motivate trend-following crypto traders to hit the market with fresh bids. Bitcoin has evolved as a macro asset since early 2020 and tends to move more or less in line with the S&P 500.
Traders, however, should note that while bitcoin's big rallies often start with a golden cross, not all golden crosses lead to a big rally.
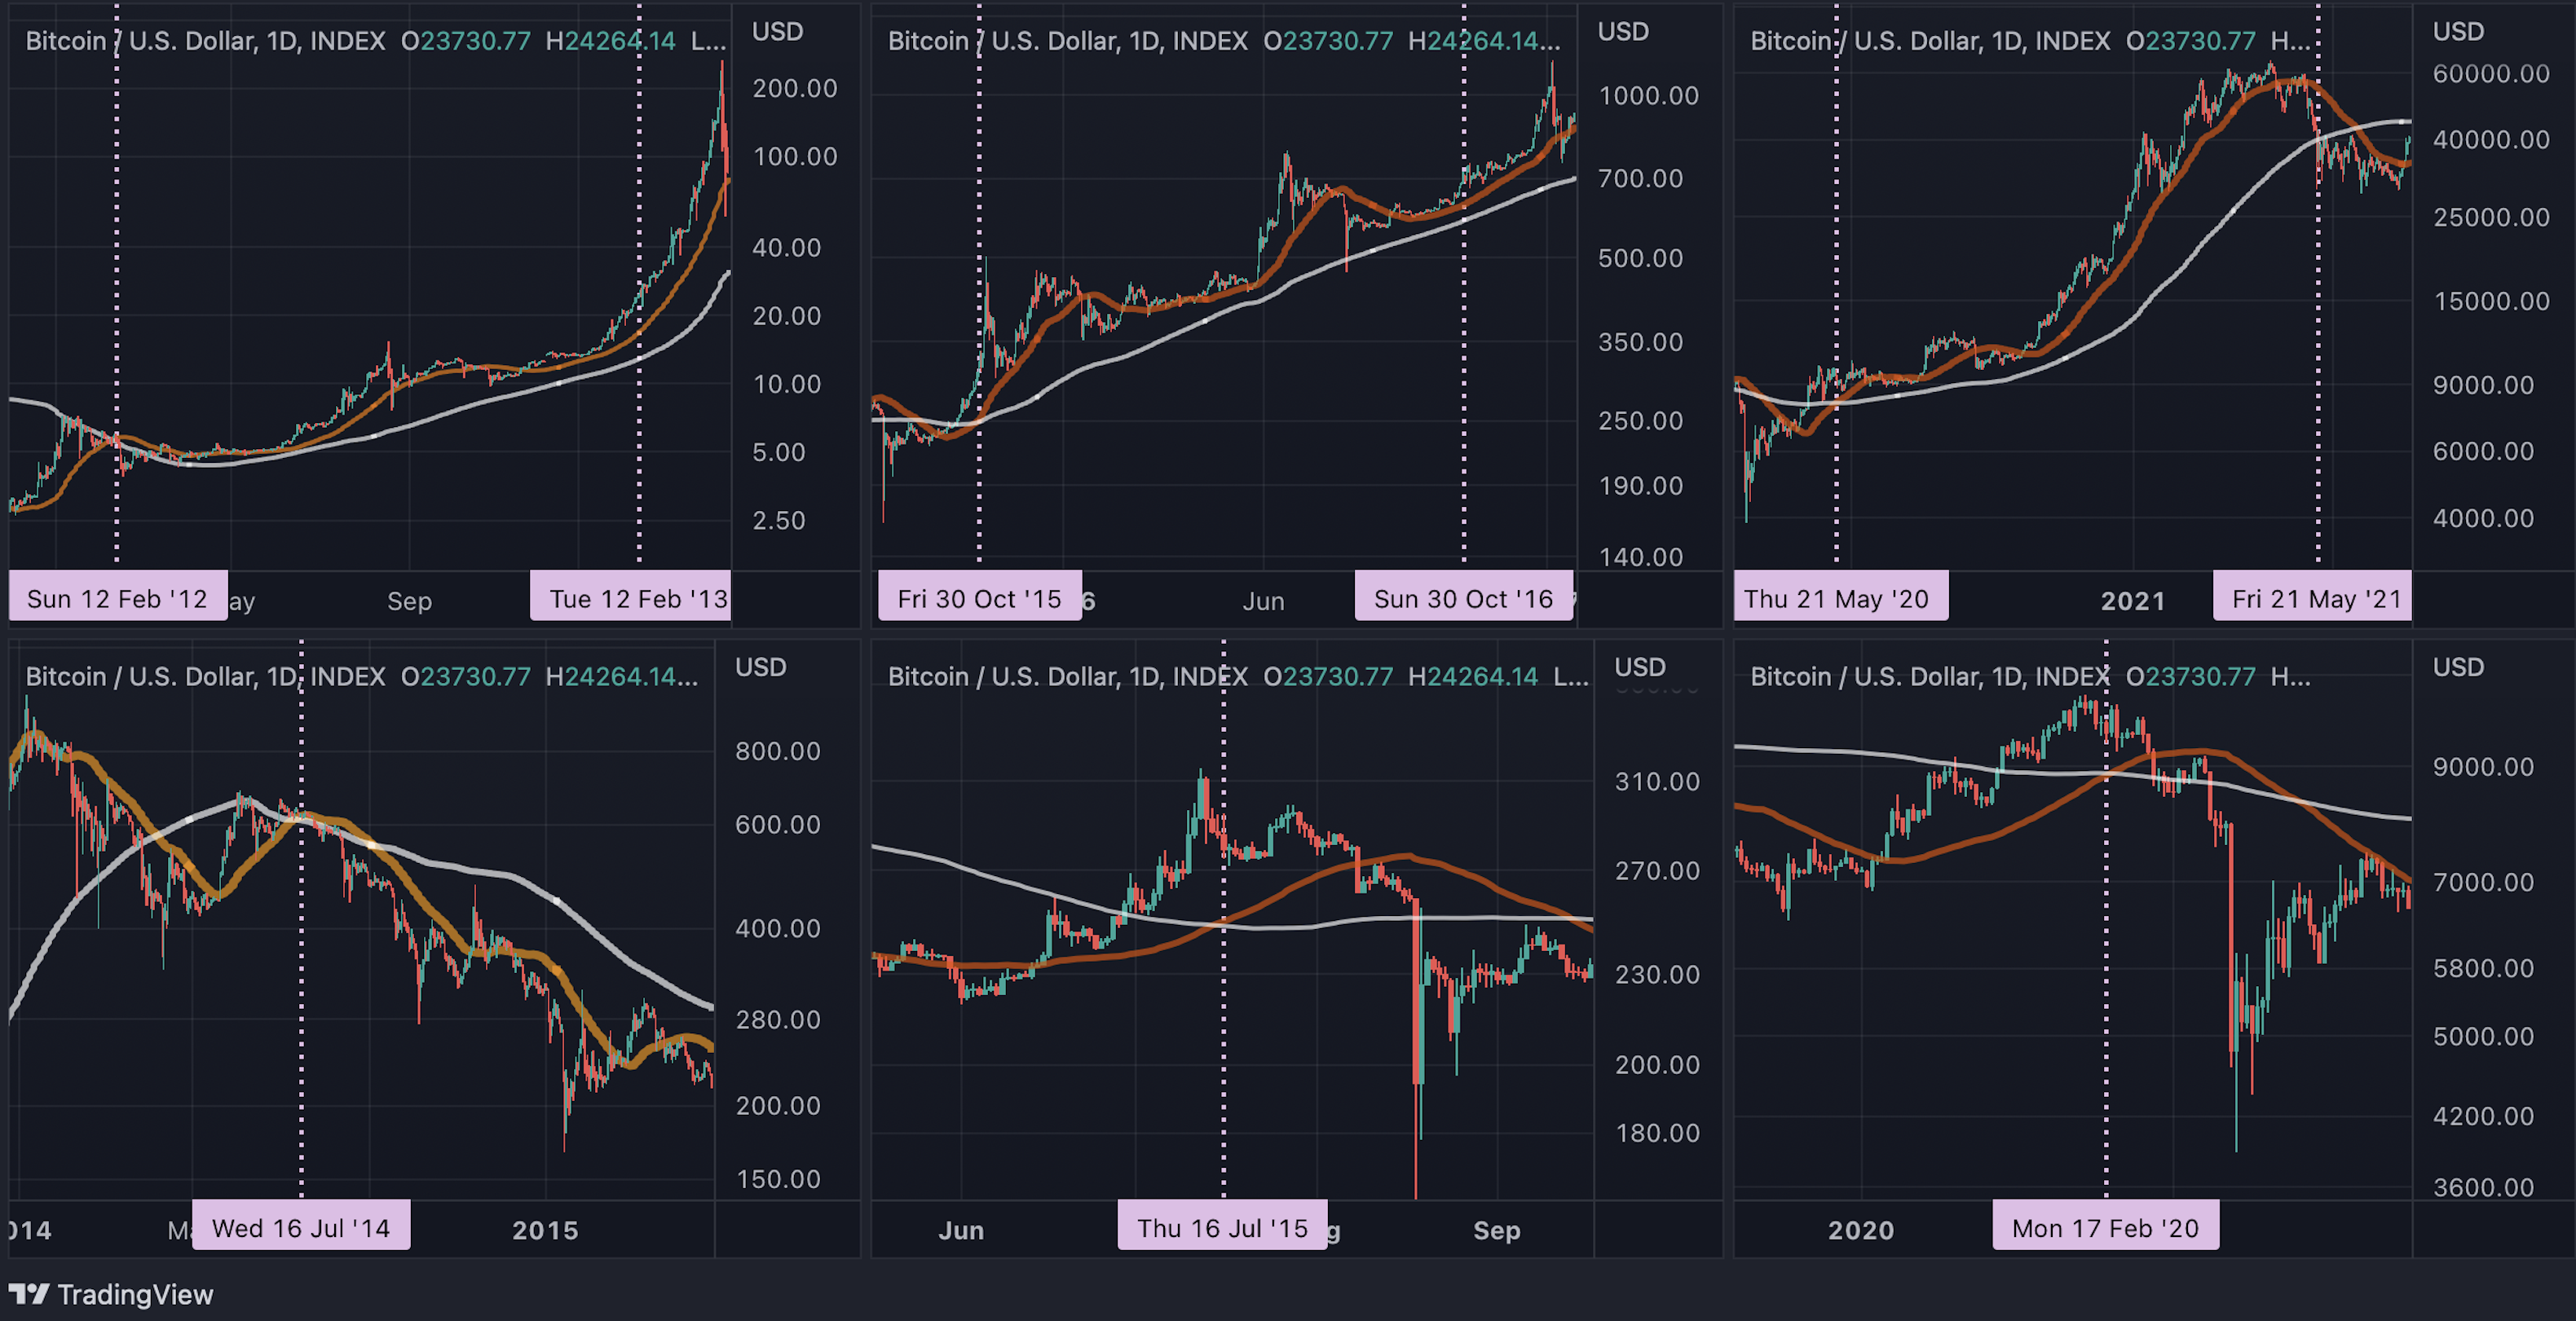
The white line represents the 200-day SMA and the other represents 50-day SMA. Golden crossovers of February 2012, October 2015 and May 2020 lived up to their reputation, as seen in the upper pane. Crossovers seen in July 2014, July 2015 and February 2020 were bull traps ((TradingView/CoinDesk))
Bitcoin has seen eight golden crosses to date, of which three, confirmed in February 2012, October 2015 and May 2020, were on point, presaging at least a yearlong bull market that saw prices rally between 100% and 350%, data from TradingView shows.
On the other hand, golden crosses of July 2014, July 2015 and February 2020 were bull traps as the cryptocurrency crashed violently into a death cross in the following weeks/months. The death cross is the opposite of the golden cross and represents a bearish shift in the long-term trend.
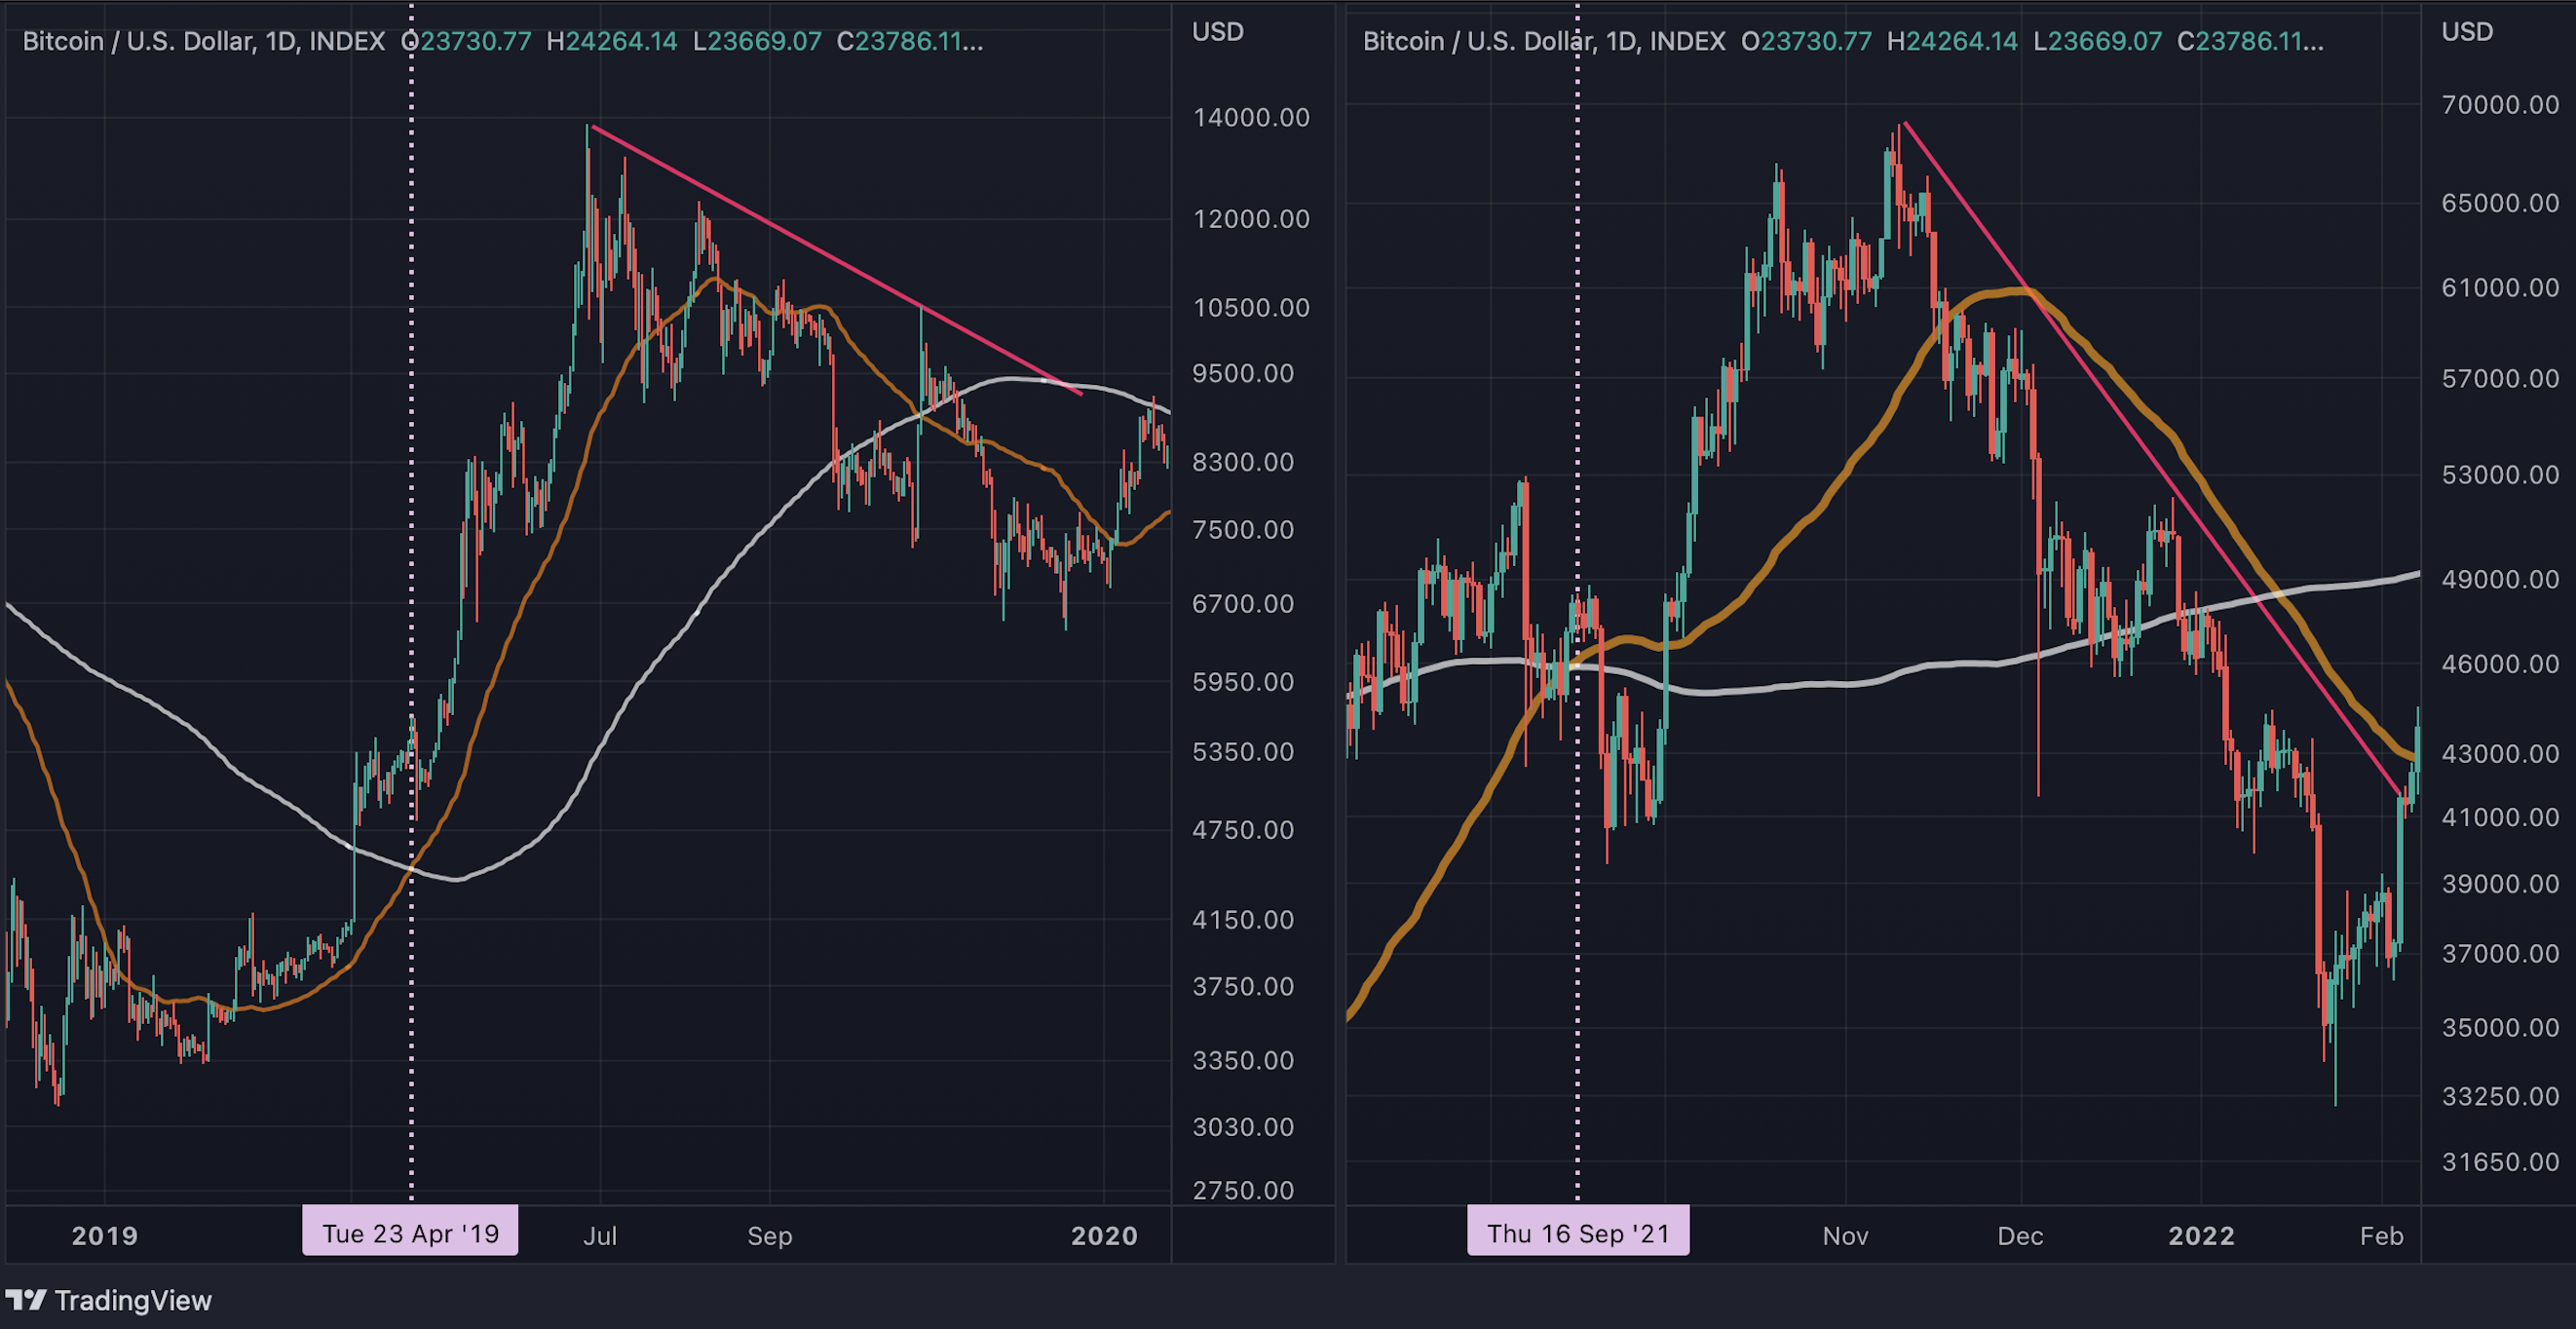
The cryptocurrency saw a notable price rise following the golden crossovers of April 2019 and September 2021. But these gains were fleeting.
The remaining two golden crossovers, formed in April and September 2019, were undecisive, with prices rising sharply in the following two months only to slip into a death cross later.
The S&P 500's past data paint a similar picture. The index has seen 52 golden crosses since 1930. In that time, stocks rose in the following year 71% of the time, according to a MarketWatch report quoting Dow Jones Market data.
So, the golden cross appears unreliable as a standalone bullish indicator and should be read in conjunction with other factors, mainly the Federal Reserve's policy, which is becoming less hawkish with each passing month.
As expected, the central bank stepped down to a smaller 25 basis point rate hike on Wednesday, lifting the benchmark borrowing cost to the new range of 4.5% to 4.75%. During the post-meeting press conference, Chairman Jerome Powell acknowledges that "inflation has eased somewhat" while downplaying the risk of tightening-induced economic recession, bringing cheer to risk assets.
According to ING analysts, the Fed is likely to deliver another 25 basis-point increase in March and then pause the rate-hike cycle that rocked financial markets last year.
Author

CoinDesk Analysis Team
CoinDesk
CoinDesk is the media platform for the next generation of investors exploring how cryptocurrencies and digital assets are contributing to the evolution of the global financial system.


