Bitcoin sets the stage for a potential “destruction of fiat currency“
- Bitcoin price action against the US Money Stock is similar to the 1970s Stagflation Era, according to Peter Brandt's recent tweet.
- Brandt's post suggests that the end of this consolidation could see BTC ascend rapidly.
- The veteran trader suggests that the devaluation of fiat currencies could propel Bitcoin.

In a recent tweet on the social media platform X, formerly Twitter, Peter Brandt, a seasoned analyst, suggested that Bitcoin (BTC) price could be due for a massive uptrend. He compared the current BTC consolidation to the Stagflation Crisis of 1970.
The argument for Bitcoin relates to the eventual destruction of fiat currency units (e.g., $USD)
— Peter Brandt (@PeterLBrandt) June 1, 2024
This chart on right plots price of Bitcoin $BTC in relationship to total U.S. money stock (M1). This ratio remains below the Dec 2017 high. Interesting to note similarities in chart… pic.twitter.com/yQEAm3lMAX
Bitcoin price action vs stagflation of the past
Instead of comparing the bare-bones chart of Bitcoin price against the stock market, as many would, Peter Brandt used BTC against the total US Money Stock. This provides context to the massive expansion of the money supply and the unprecedented monetary policies implemented by central banks in response to the COVID-19 pandemic.
This comparison puts in perspective how the two events, the COVID-19 and stagflation era, although spread far apart from each other, could have had a similar effect devaluating effect on fiat currencies. It is clear that the events that occurred in 1970 demonstrated two important facets of fiat currencies – fragility and the potential for their devaluation in the face of economic turmoil and misguided policies
The only difference between the 1970s and 2024 is the presence of a better currency—Bitcoin. Not only is BTC’s supply fixed and limited, but it could emerge as a viable alternative to fiat currencies and a hedge against inflation. Additionally, the institutions already see it as an alternative, which also explains the recent regulatory developments that have led to the approval of not one but two spot crypto ETFs.
So, Brandt’s post states that if history rhymes, BTC’s market value could ascend rapidly,much like the post-1970s stagflation. This aligns with Bitcoin’s core argument, i.e., " destruction of fiat currencies.”
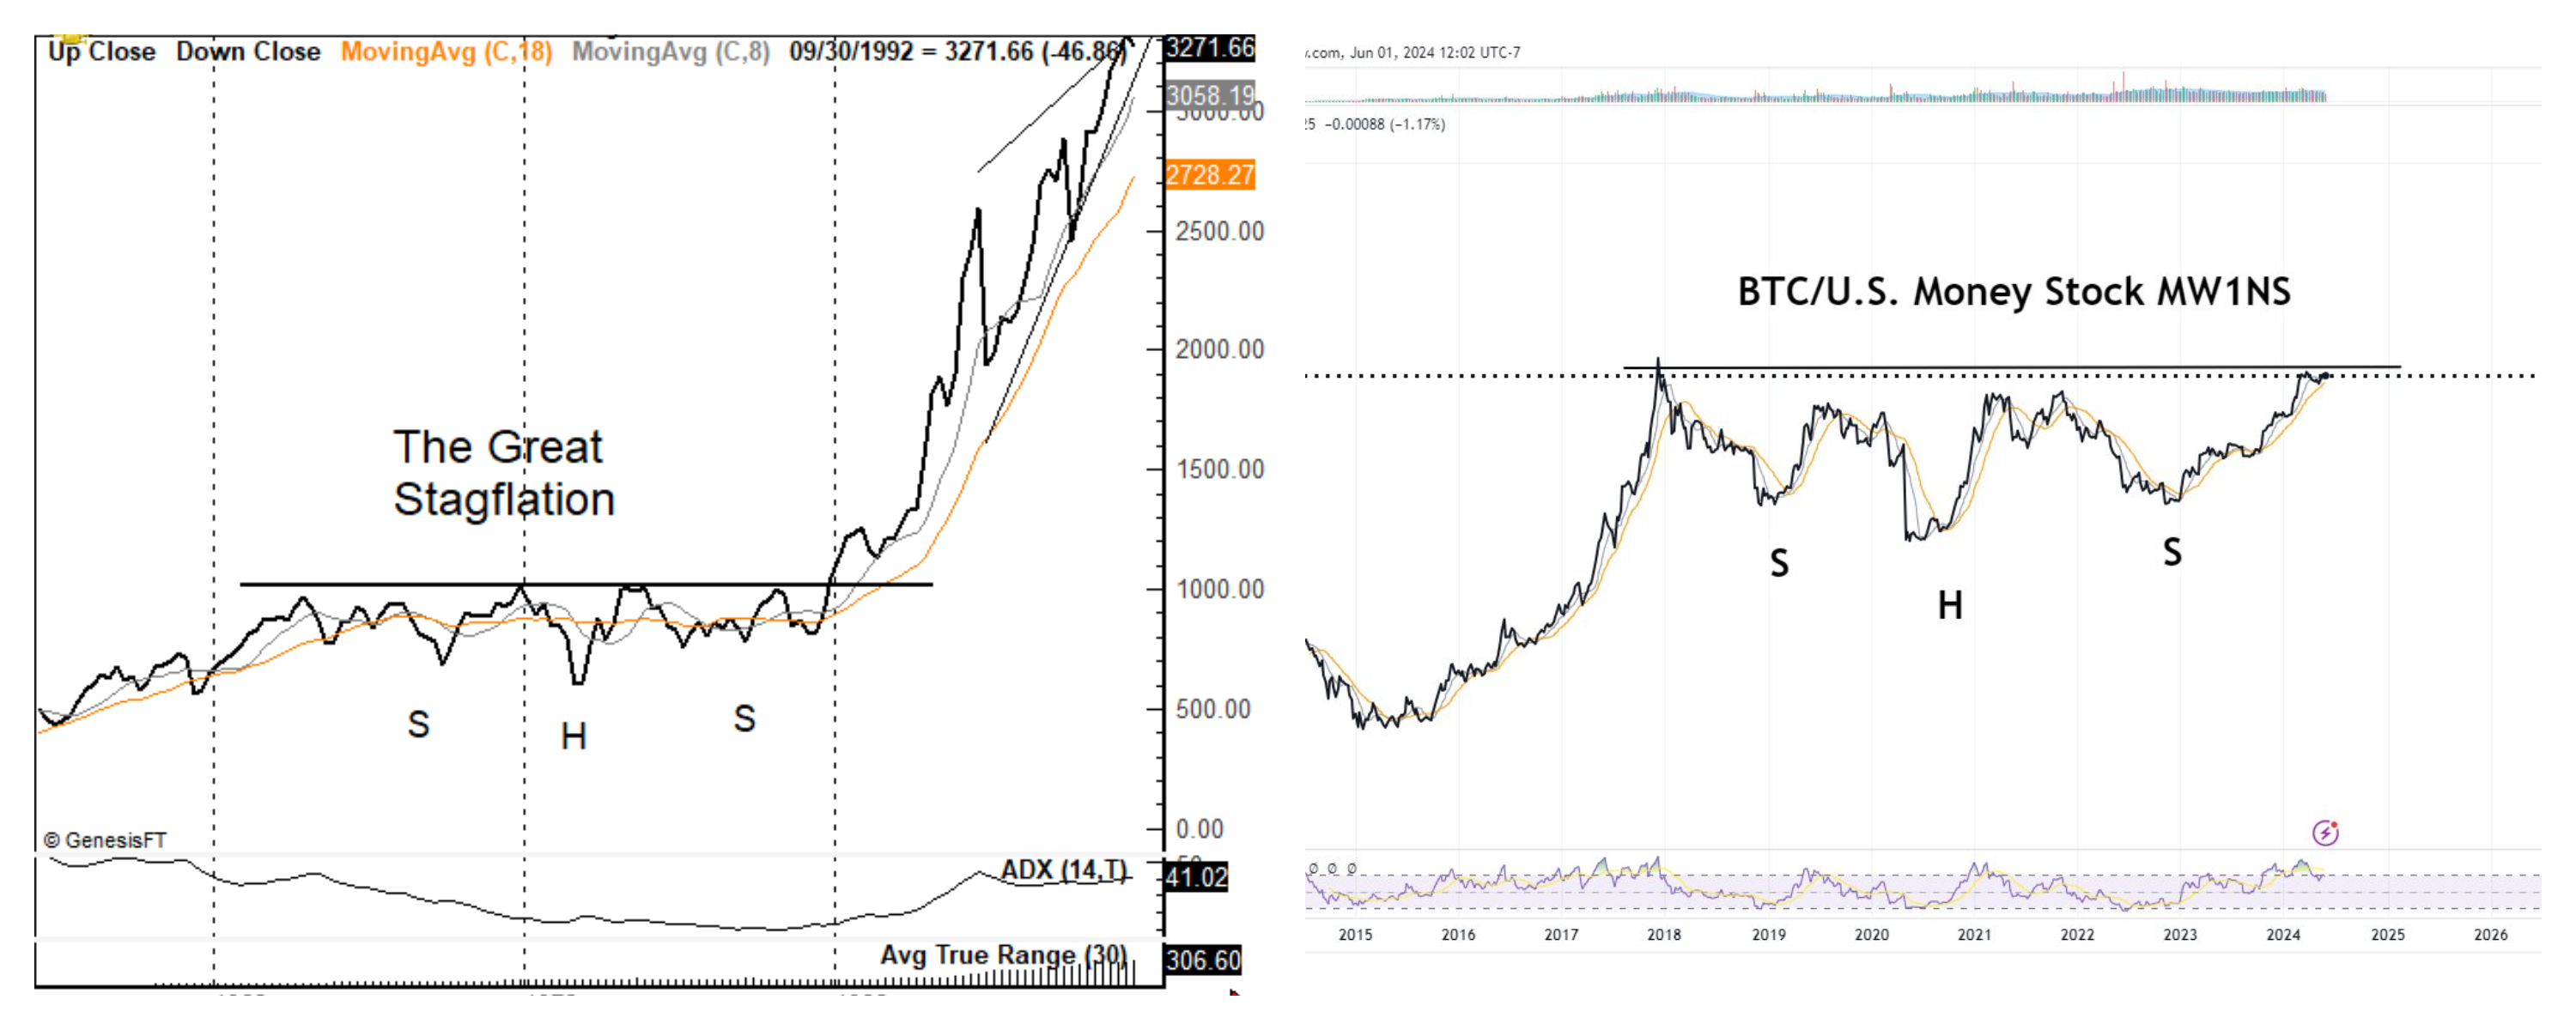
BTCUSD/WM1NS 1-week chart
BTC target if history repeats
Due to the comparison of BTC against US Money Stock, it is unlikely to find targets based on simple chart pattern projections. The long-term target of Bitcoin price continues to remain mysterious, with forecasts from industry experts that range from $100,000 to $1 million per BTC.
For a short-term target and how BTC could play out, refer to the following FXStreet posts.
Author

Akash Girimath
FXStreet
Akash Girimath is a Mechanical Engineer interested in the chaos of the financial markets. Trying to make sense of this convoluted yet fascinating space, he switched his engineering job to become a crypto reporter and analyst.



