Bitcoin Weekly Forecast: BTC likely to provide another buying opportunity
- Bitcoin price shows signs of correction on the 4four-hour chart.
- Investors should pay attention to the $63,000 level for buying the dips opportunity.
- On-chain data shows the higher timeframe outlook remains bullish.
- A weekly candlestick close below the $60,000 level will invalidate the bullish outlook.

Bitcoin (BTC) price looks weak on the lower timeframes, which might provide opportunities to accumulate. The daily and weekly charts retain their bullish outlook and suggest that the continuation of the 2023 bull run is not a question of “if” but “when.”
Read more: Bitcoin Weekly Forecast: Should you buy BTC here?
Bitcoin price likely to slide lower
This forecast uses a bottom-up approach to analyze Bitcoin price to better suit day traders' needs.
The four-hour chart shows that BTC is producing lower highs since setting up an all-time high (ATH) of $73,794 on March 14. Although the early May rally suggested a comeback from bulls, there might be one last liquidity sweep before Bitcoin kickstarts its uptrend.
In this regard, investors can expect Bitcoin price to continue its slow descent into the 4-hour imbalance, extending from $62,984 to $64,733. Interestingly, the Volume Profile shows that the highest traded volume level sits at $62,948, coinciding with the 4-hour imbalance’s lower limit. This level is termed Point of Control (POC), making roughly $63,000 a good level to accumulate BTC.
The Relative Strength Index (RSI) signs of a potential bearish divergence developing below the mean level of 50. This outlook adds credence to the lack of bullish momentum on the lower timeframes.
So, investors should be prepared for a 5% to 8% drop in BTC in the next few days.
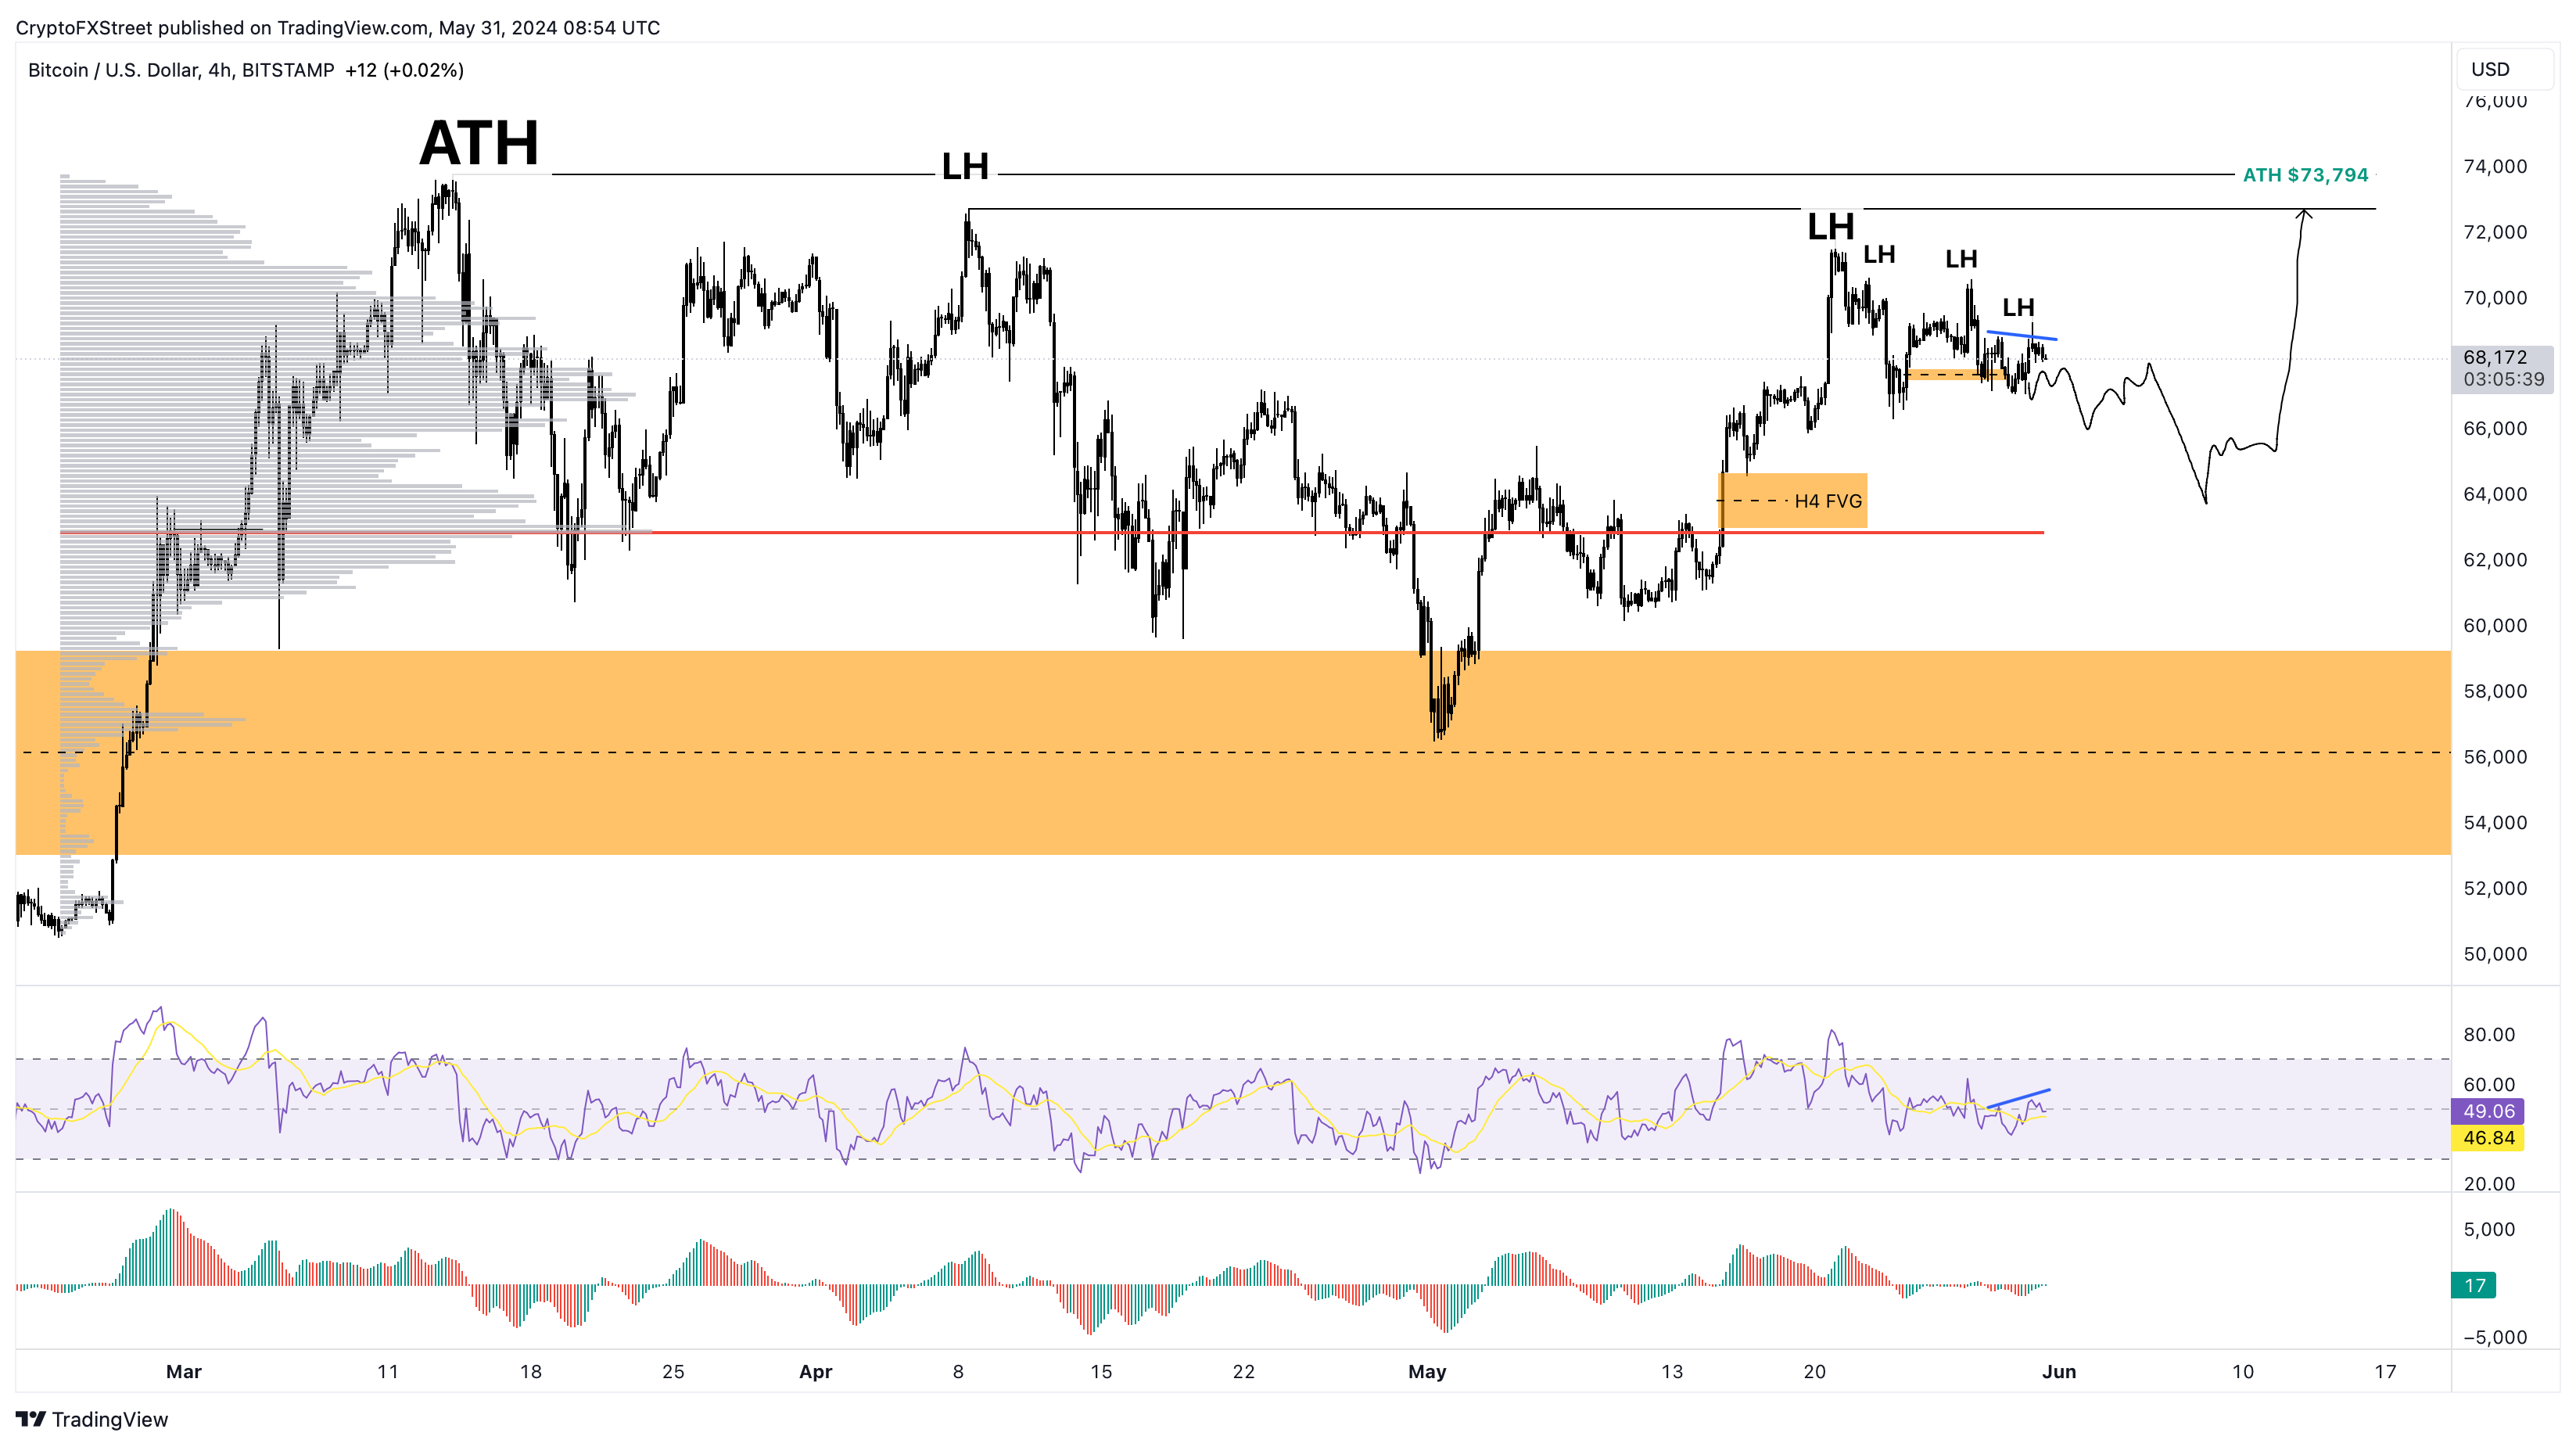
BTC/USDT 4-hour chart
Read more: Bitcoin Weekly Forecast: Is BTC out of the woods?
On the daily chart, the $63,796 is the stable support level and it roughly coincides with the 4-hour level, providing a bullish confluence for buying the dips.
Although unlikely, investors should consider what could happen if the 4-hour imbalance or the POC fails to hold. In such a case, Bitcoin's price could see a steeper correction that knocks BTC inside the weekly and monthly imbalance, stretching from $53,120 to $59,111. The May 1 crash failed to retest the aforementioned imbalance’s midpoint at $56,189. So, patient and long-term investors should consider leaving bids at this level.
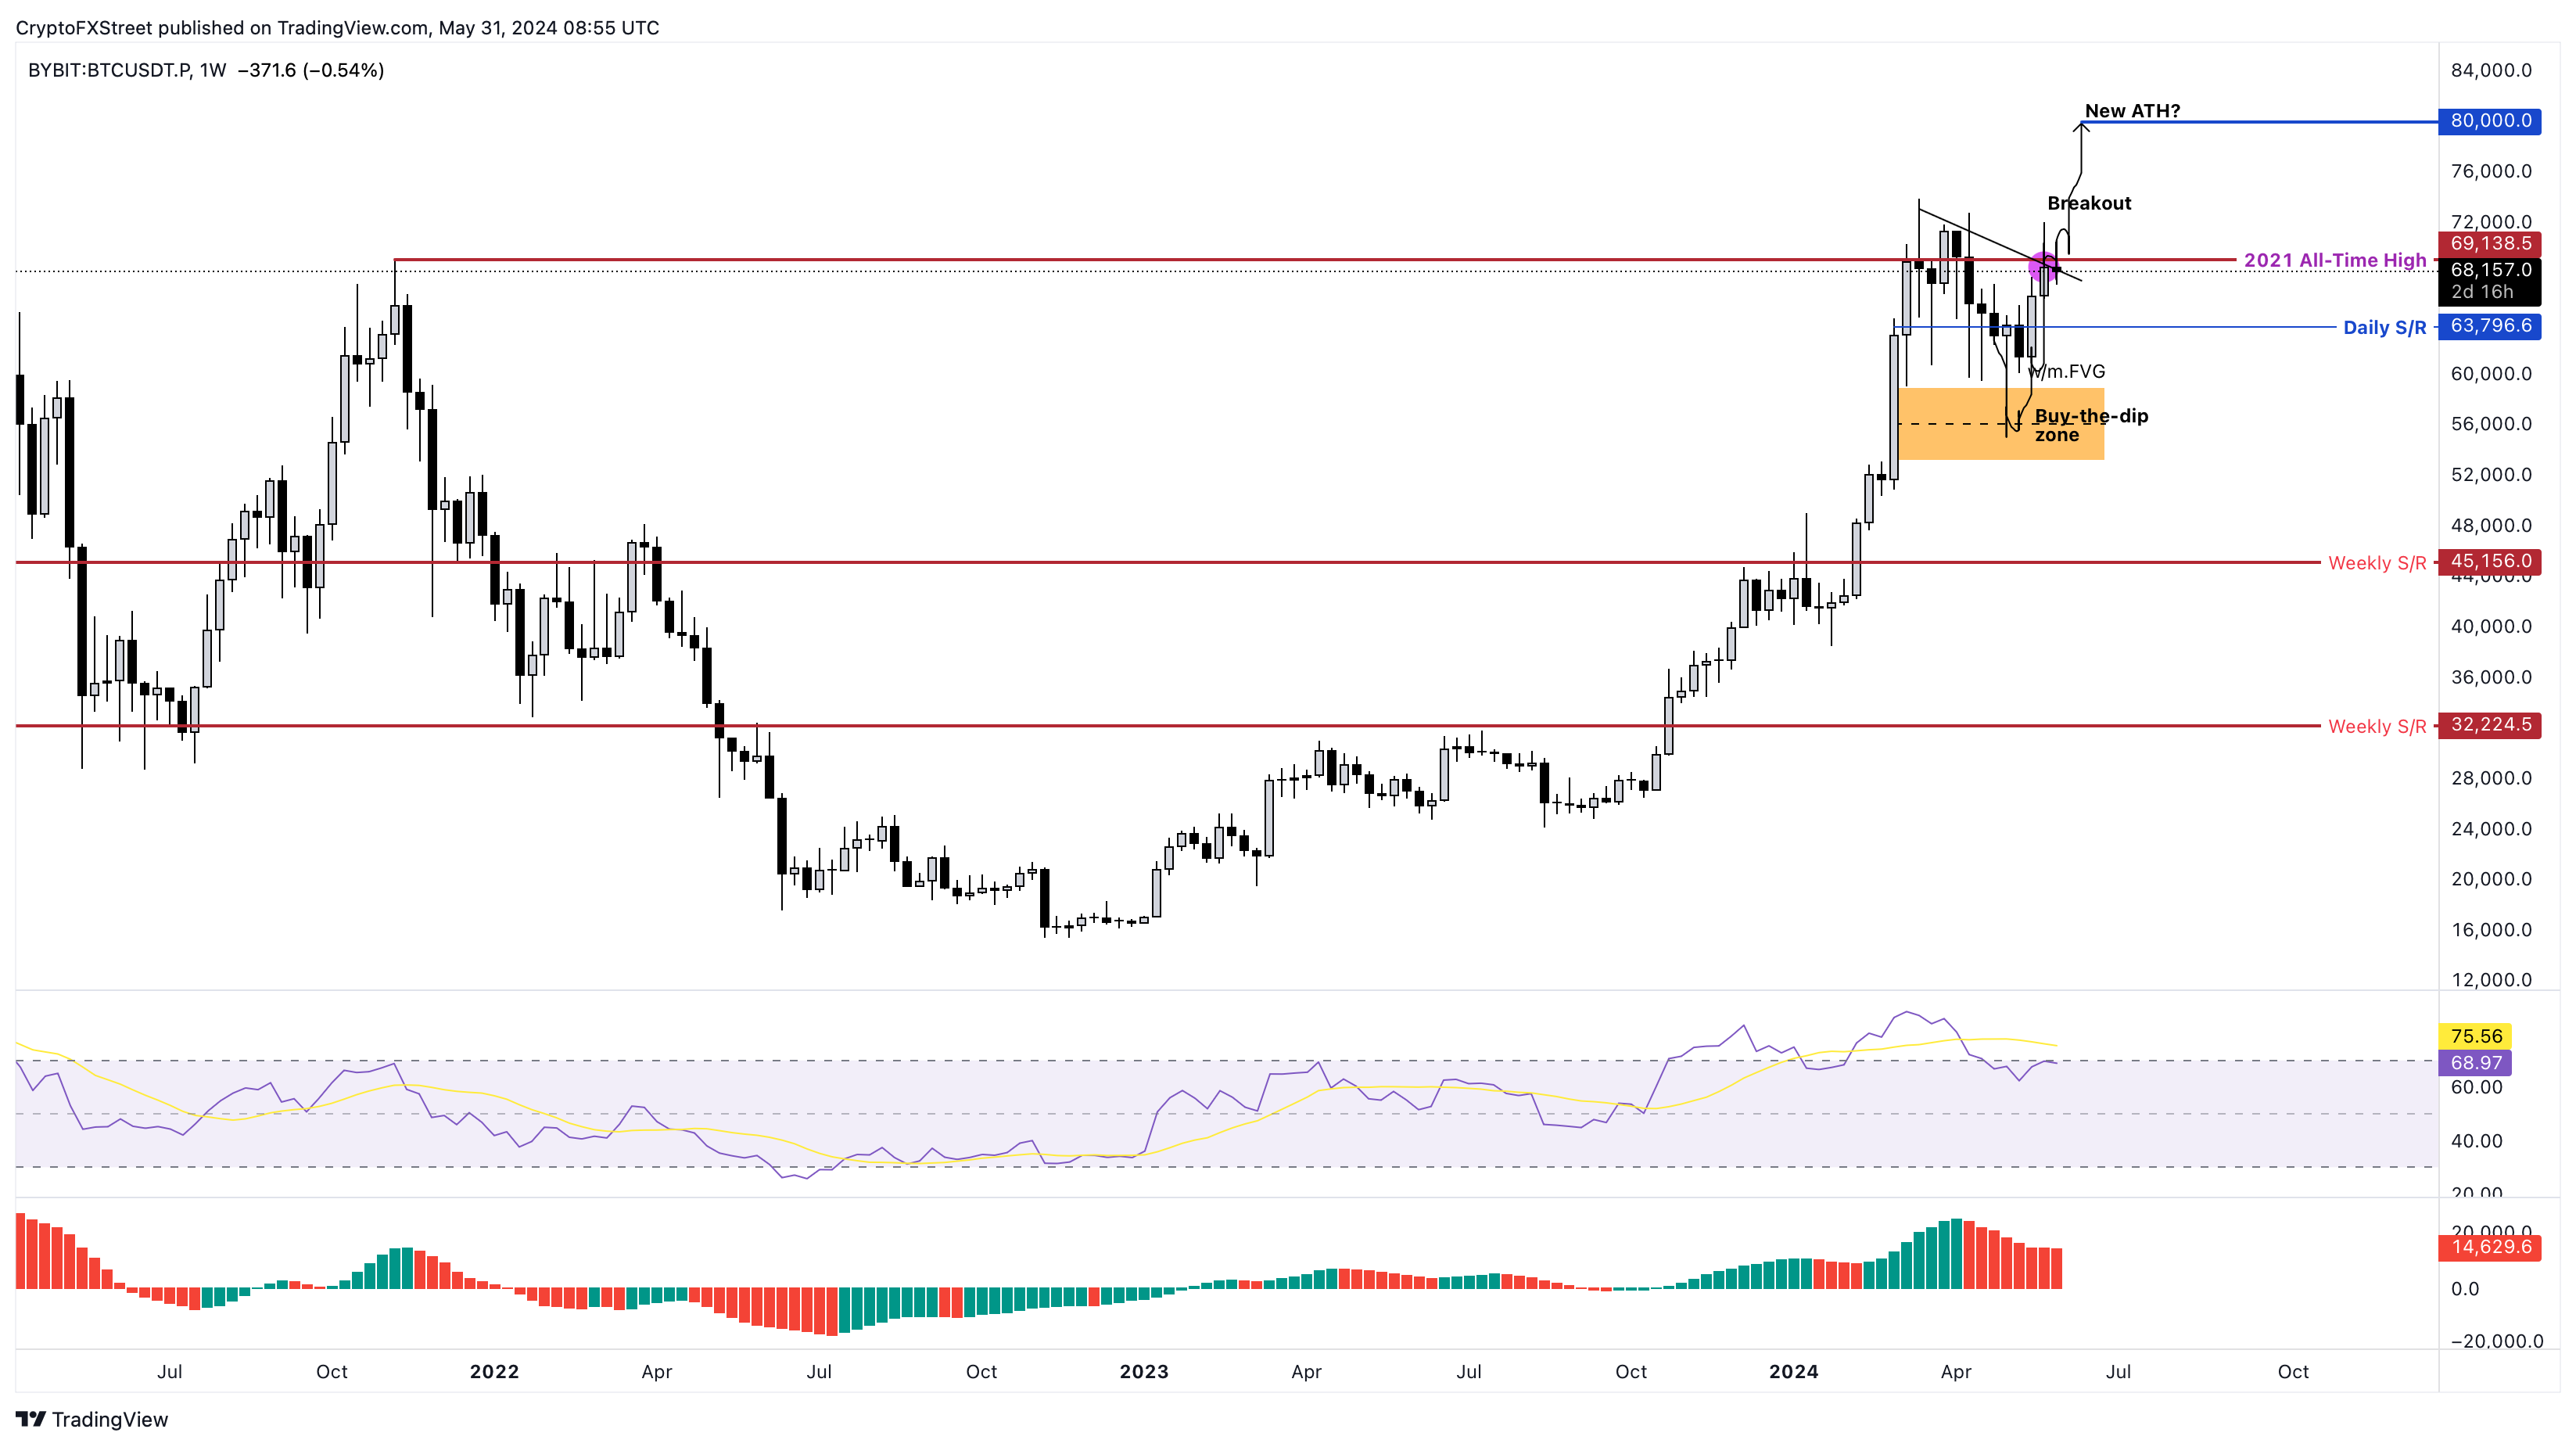
BTC/USDT 1-day chart
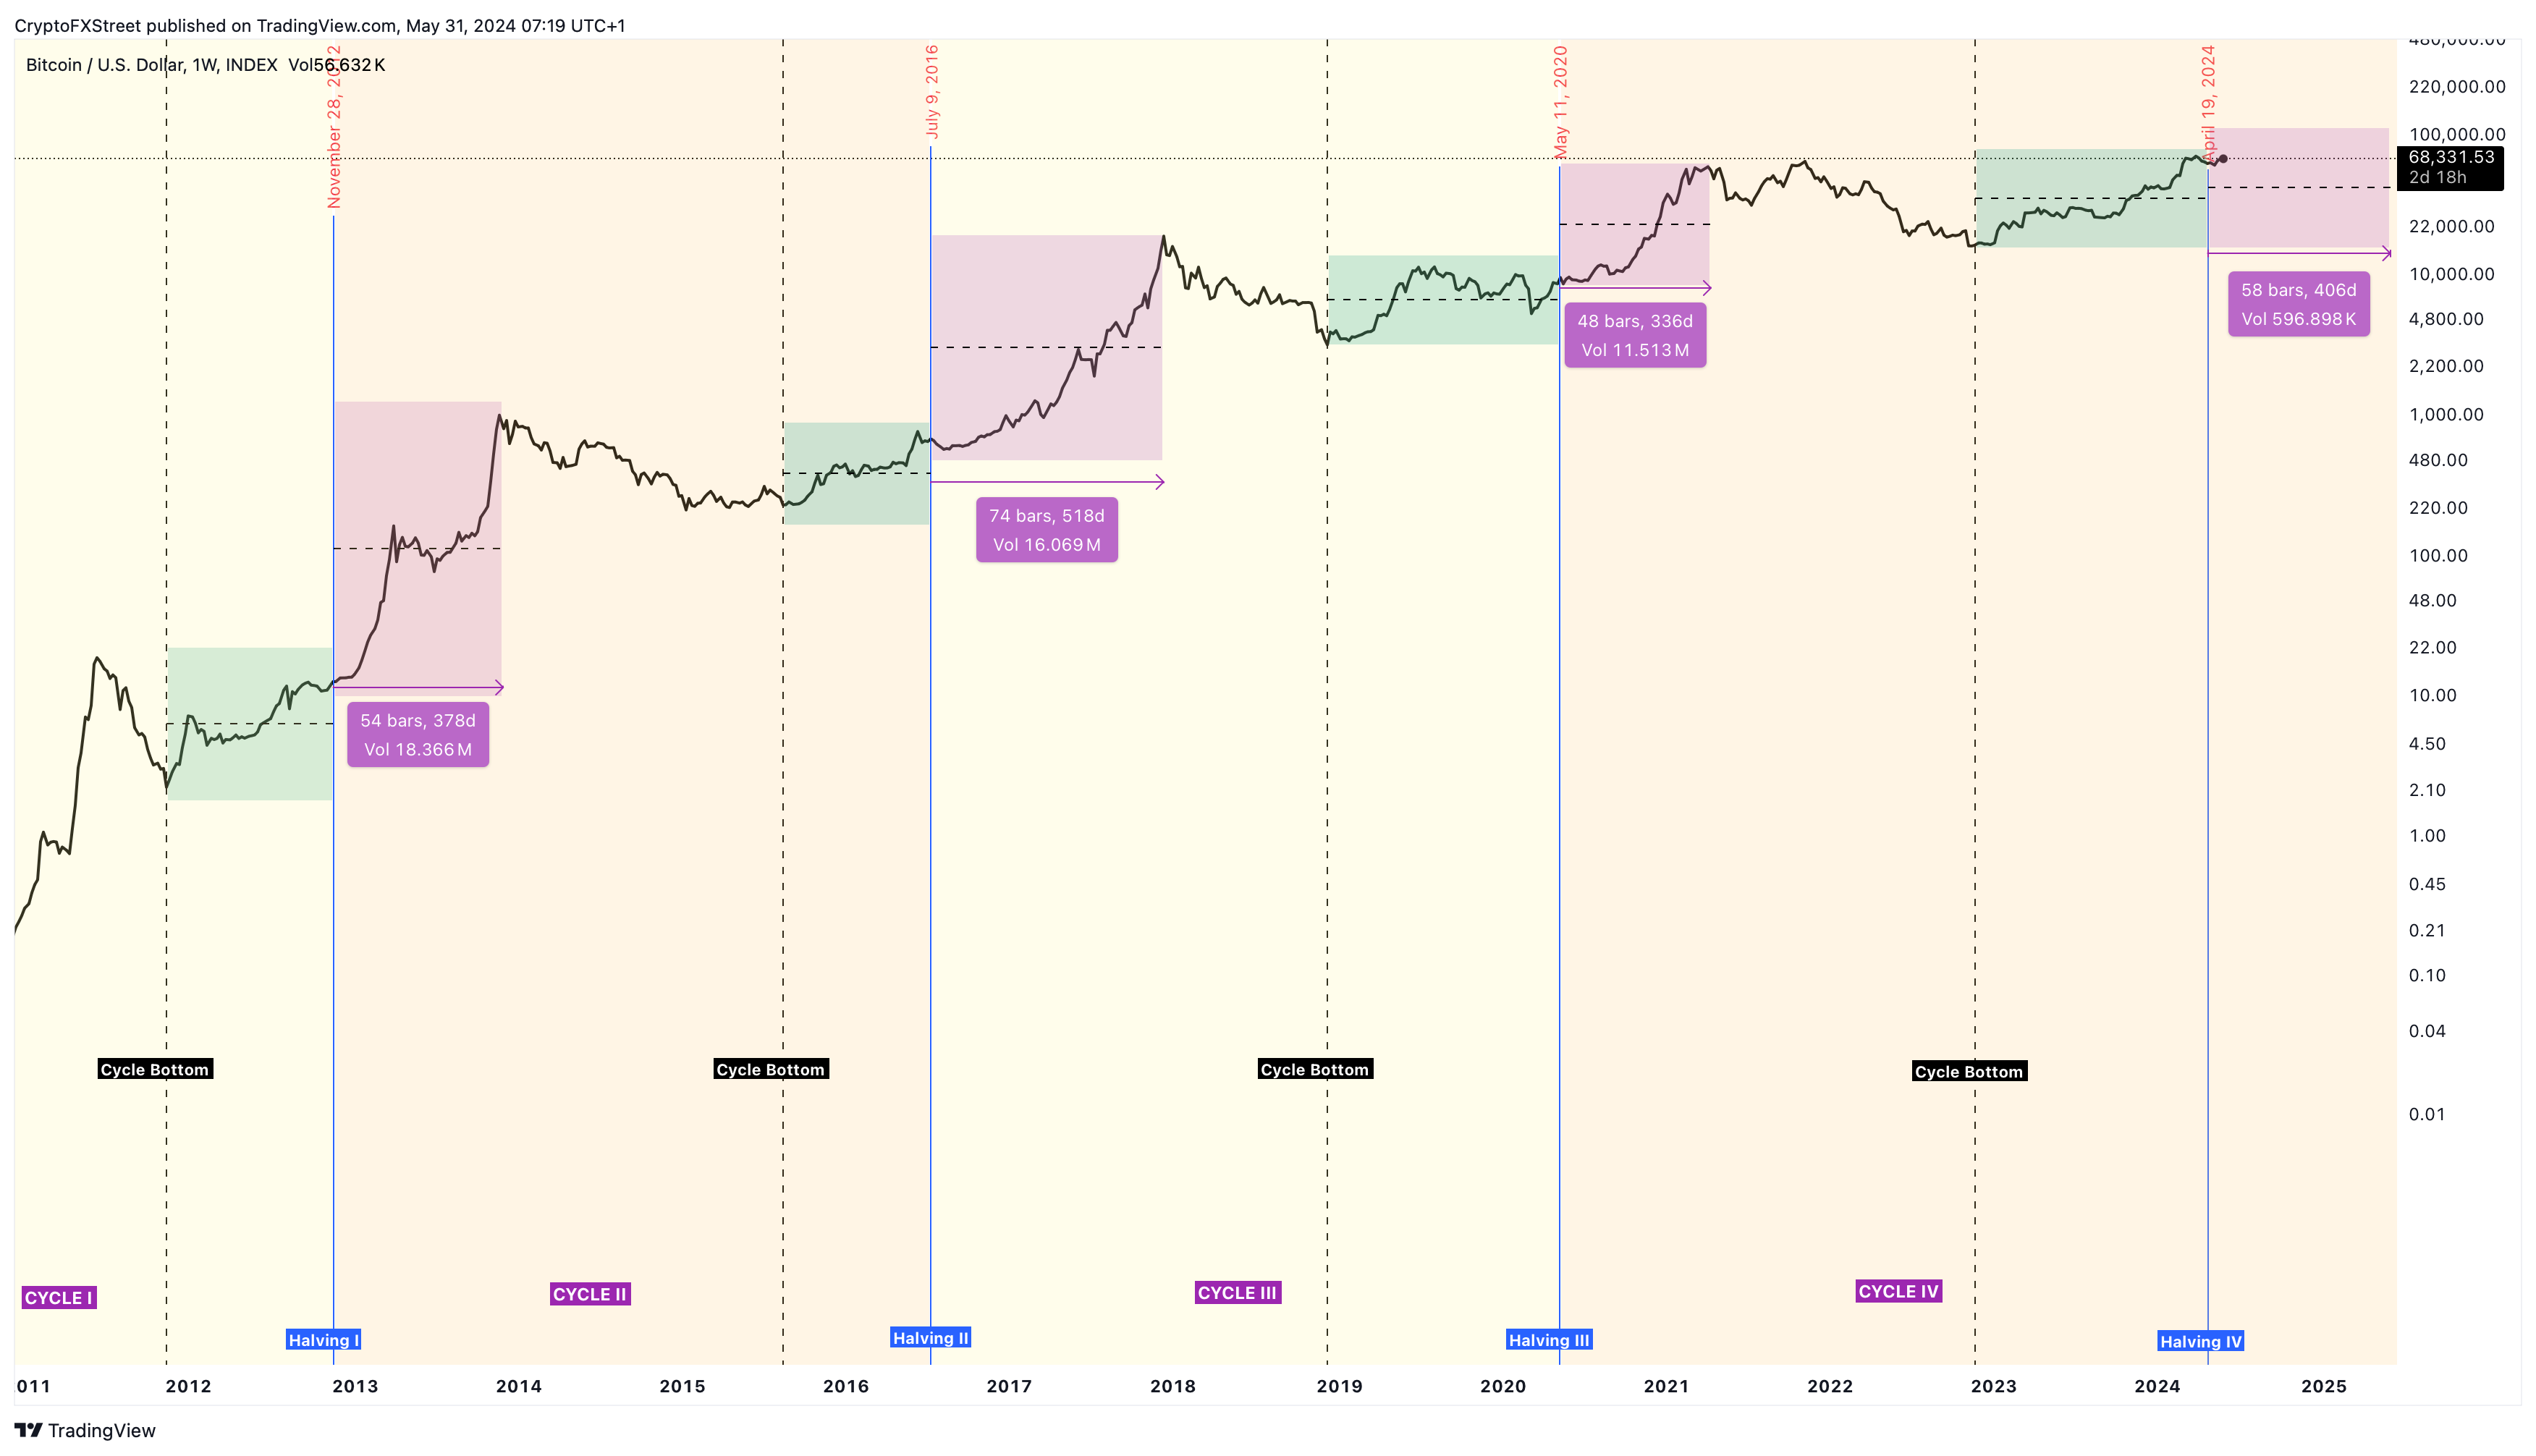
The upside target for Bitcoin price, from a conservative standpoint, remains the same – the $80,000 psychological level.
BTC/USD 1-week chart
To know more about the above chart and Bitcoin’s post-halving thesis - Click here
According to IntoTheBlock’s Large Transactions Volume index, institutional activity has slowed down recently. Between May 21 and 31, this metric dropped from $67 billion to $38 billion, indicating that whales are not interested in BTC at the current levels and are not accumulating.
Unlike the Number of Large Transactions metric, the Large Transactions Volume indicator tracks transfers worth $100,000 or more but excludes the transactions that lead back to the original wallet, making it more reliable.
This indicator shows that the short-term outlook for BTC is slightly uncertain, but the high timeframe outlook remains bullish.
BTC Large Transactions Volume
The 365-day Market Value to Realized Value (MVRV) indicator, which currently hovers around 30%, confirms the big-picture optimism. The 30% value indicates that investors who purchased BTC in the past year are currently sitting at an average profit of 30%. This value is relatively small, and it’s unlikely that investors sell here to book profits. This can be confirmed by looking at the Bitcoin price history, which shows that the 365-day MVRV indicator was in the triple-digit territory when cycle tops were formed.
For example, the mini bull run of 2019 peaked when the 365-day MVRV hit 103%, and for the 2021 bull run top, this index flashed 104%. Hence, the 2023 uptrend is still intact and Bitcoin price has a long way to go before a cycle top is formed.
 [11.07.39, 31 May, 2024]-638527426535439327.png)
BTC 365-day MVRV
On the other hand, if Bitcoin price produces a weekly candlestick close below $60,000, it would produce a lower low on a high timeframe, signaling a break in the bullish market structure. This move would invalidate the bullish thesis and potentially trigger a 15% crash to sweep the February 26 swing low of $50,909.
Author

Akash Girimath
FXStreet
Akash Girimath is a Mechanical Engineer interested in the chaos of the financial markets. Trying to make sense of this convoluted yet fascinating space, he switched his engineering job to become a crypto reporter and analyst.


