Bitcoin set to form death cross as Dollar Index teases Golden crossover
-
Bitcoin's daily chart is set to show a so-called death cross, a major bearish technical pattern, for the first time since January 2022.
-
Past data show the death cross is not reliable as a standalone indicator.
-
Strengthening U.S. dollar and macro developments suggest tough times ahead for risk assets, including cryptocurrencies.

The Bitcoin (BTC) price seems set on doing the opposite of whatever the dollar index (DXY) does.
The leading cryptocurrency's 50-day simple moving average is on track to drop below its 200-day SMA, confirming a so-called death cross, the first since January 2022. The dollar index, which tracks the greenback's value against major world currencies, looks set to confirm the opposite – a golden cross.
Bitcoin's death cross, likely to happen in the next few days, indicates that short-term price momentum is underperforming the long term, with the potential to evolve into a bearish trend. Ether (ETH), the second-largest cryptocurrency by market value, is also on the verge of flashing a death cross.
"On the Bitcoin chart, such a pattern [death cross] could form next week," AlexKuptsikevich, the senior market analyst at FxPro, said in an email on Monday. "Such a signal suggests a further decline, emphasizing the bearish trend here."
Still, history shows that a bitcoin death cross is unreliable as a standalone indicator.
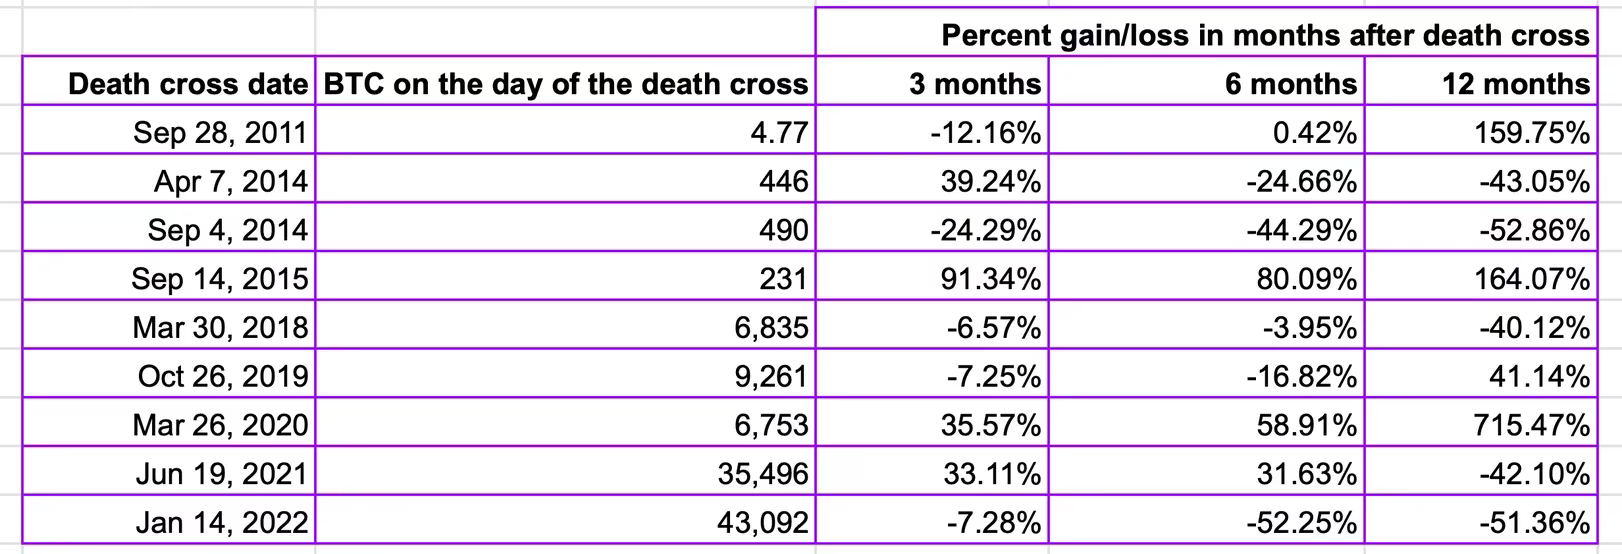
The table shows death cross is not reliable as a standalone indicator and has trapped sellers on the wrong side of the market several times in the past. (TradingView/CoinDesk) (TradingView/CoinDesk)
The cryptocurrency has seen nine death crosses in the past, of which only two led to negative returns over three-, six- and 12-month timeframes. Only five times out of nine was bitcoin trading lower a year after the death cross.
The death cross looks set to happen just as the dollar index appears on pace to chalk up a golden crossover amid a worsening macroeconomic outlook for risk assets.
The DXY's 50-day SMA could top the 200-day SMA in the coming weeks. A golden crossover is widely taken to represent the beginning of a bull run.
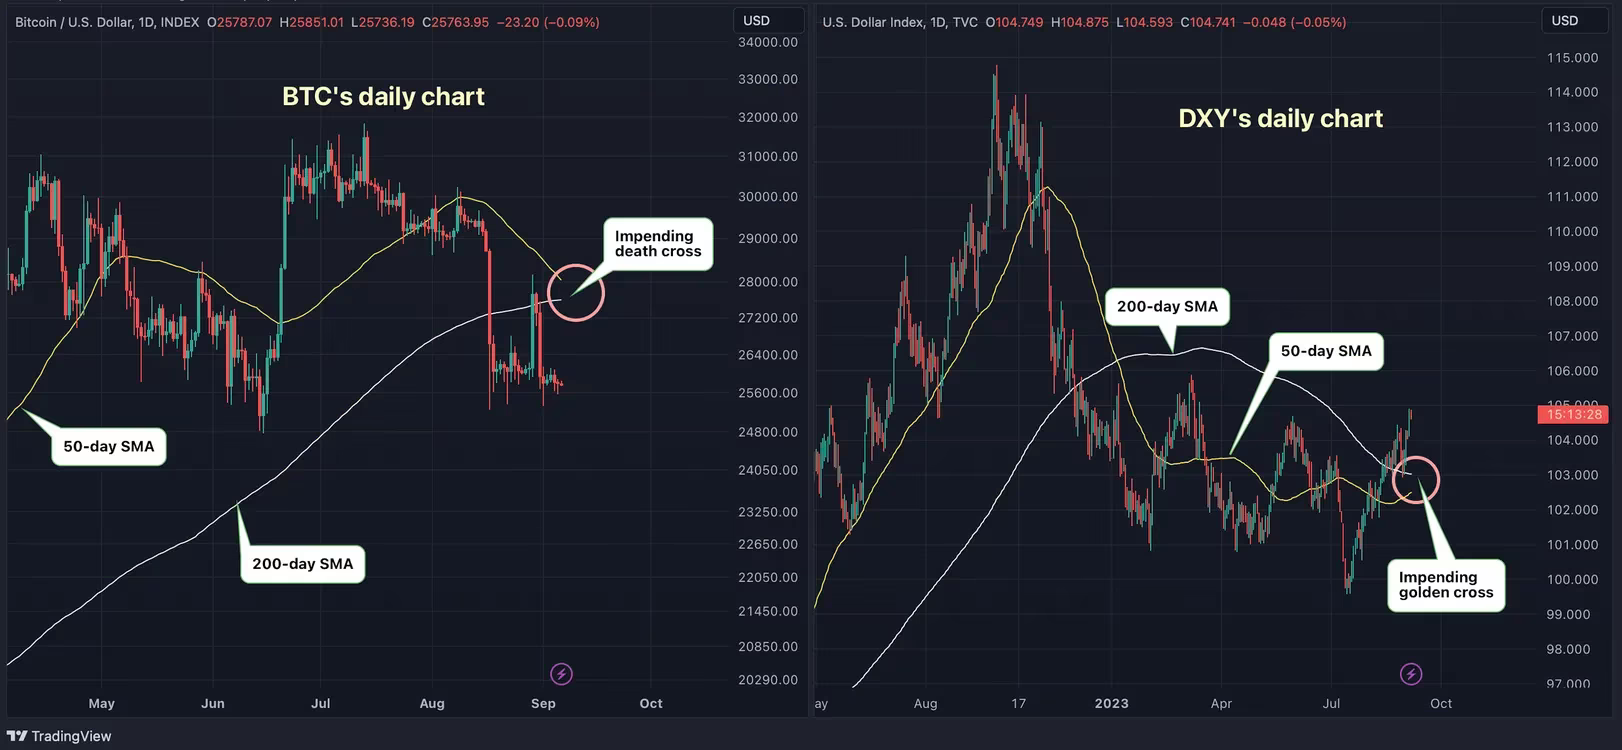
Daily charts of BTC and DXY (TradingView/CoinDesk)
Bitcoin and other risk assets, like technology stocks, are usually inversely correlated with the dollar index. The index has risen 5.3% to 104.90 since mid-July, hitting the highest since March 15, according to charting platform TradingView. Bitcoin declined 19% in the same period.
According to the International Monetary Fund (IMF), the U.S. dollar is the global reserve currency, accounting for most global trade, non-bank borrowing and international debt. That means a rally in the U.S. dollar causes financial tightening worldwide, putting downward pressure on risk assets.
"The FX market has come under the spell of higher energy prices. U.S. energy independence and its net exporter status leave the dollar well-positioned for higher energy prices. It would seem the only real threat to the dollar in the near term would be some dramatic re-assessment of growth prospects," analysts at ING said in a note to clients on Tuesday, explaining the dollar's rise.
According to ING, with the U.S. economy chugging along quite well, markets are beginning to question expectations for rapid fire rate cuts by the Federal Reserve (Fed) next year. Hopes for a so-called dovish Fed pivot partly aided bitcoin's recovery from 2022's lows. The Fed has raised rates by over 500 basis points since March last year.
ING said that the new-found wisdom about low chance of quick rate cuts means the path of least resistance for longer duration U.S. Treasury yields is higher. In other words, the yield curve may see what's known as a bear steepening (de-inversion), which has historically marked major tops in risk assets.
"I’m finally turning more constructive on crypto (yes, I see the prices), but I fear we must first get through a tricky inflection point on the macro side," Ilan Solot, co-head of digital assets at Marex Solutions, said in an email. "The risk is a serious flush out of longer-dated yields and growth assets causing temporary re-coupling crypto as the new sock puppet proxy for quant traders."
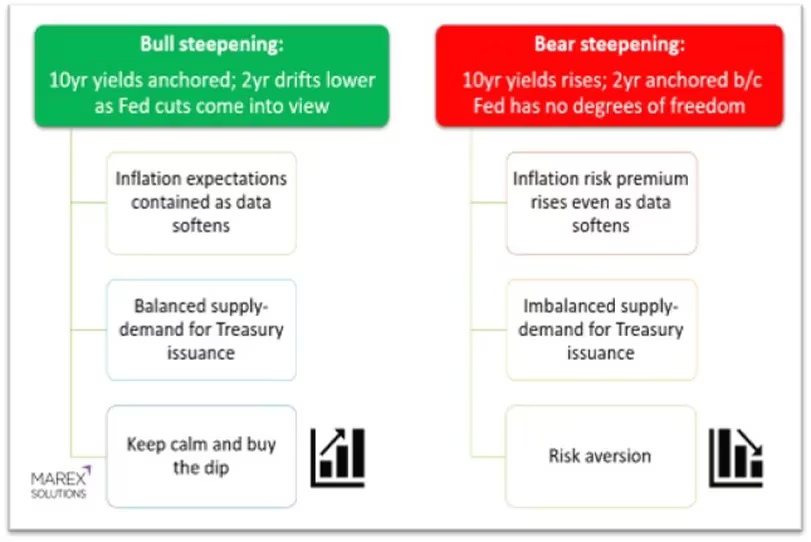
A bear steepening, where long-term rates price in higher for longer interest rates and short duration yields hold steady, could cause risk aversion (Marex Solutions) (Marex Solutions)
"I’m pretty convinced the curve steepening train is leaving the station; the question is (a) the energy behind the move and (b) whether it’s on a bull or bear steepening track. Unfortunately, I’m leaning towards the latter – hope I’m wrong," Solot said.
Author

CoinDesk Analysis Team
CoinDesk
CoinDesk is the media platform for the next generation of investors exploring how cryptocurrencies and digital assets are contributing to the evolution of the global financial system.


