Bitcoin price to take a breather as midsize US banks request Fed to insure deposits for two years
- Bitcoin price and momentum indicators do not seem to be aligned, suggesting the possibility of a reversal.
- Investors need to be confident in their approach and decide if they want to sell or accumulate more.
- Invalidation of the ongoing bull rally will occur on a decisive flip of the $21,405 support level.

Bitcoin price has experienced a quick rally after dipping into the weekly inefficiency to the downside. As a result, the second leg of the uptrend began in March, pushing BTC to nine-month highs and another inefficiency to the upside. However, the big crypto seems to be developing a divergence on the three-day chart, which could be an opportunity to accumulate or sell-signal for bears. But as the banking crisis deepens, this move could affect the BTC’s next move.
Also read: Why Tether (USDT) and TrueUSD (TUSD) whales are key for crypto bull rally?
Small banks seek refuge with the Federal Reserve
A coalition of mid-size banks has requested the federal authorities to extend its support amid falling banking system. The banks reason that if the Fed insures deposits for two years, it would restore investor confidence and prevent a further run on the banks.
As reported by Bloomberg, this coalition’s letter says that “the overall health and safety of the banking industry, confidence has been eroded in all but the largest banks” and the “confidence in our banking system as a whole must be immediately restored.”
Read More: Silicon Valley Bank and Signature Bank hearing to be held on March 29, FDIC Chairman set to witness
Bitcoin price shows a build-up of exhaustion
Bitcoin price triggered its first run-up in January as it inflated 41% in the first three weeks. This move was followed by a power struggle between the bulls and bears, which led to a sideways movement and a deep pullback into the inefficiency, extending from $17,181 to 20,388. This inefficiency is termed a Fair Value Gap (FVG) and was created on the weekly timeframe as there was an excess of bullish momentum from investors. Thus, this FVG is also known as the buy-side imbalance.
Typically, after creating a buy-side imbalance, the asset pulls back into this zone to rebalance and, in some cases, fuel up for the next leg. For Bitcoin price, the retracement allowed sidelined buyers to step in and trigger the second phase of the rally that pushed the big crypto to tag a nine-month high of $27,763.
Interestingly, Bitcoin price went from a buy-side imbalance to a sell-side imbalance, which extends from $26,877 to $29,220. The current position of BTC makes it so that there could be a further extension of the rally up to $29,220.
While Bitcoin price action has scaled new monthly highs, investors should note that the successive higher highs created since mid-January do not align with the Relative Strength Index (RSI) and Awesome Oscillator (AO) momentum indicators which denote a declining strength from the buy side.
This non-conformity reveals the development of a bearish divergence, which results in either a small pullback or a deep correction.
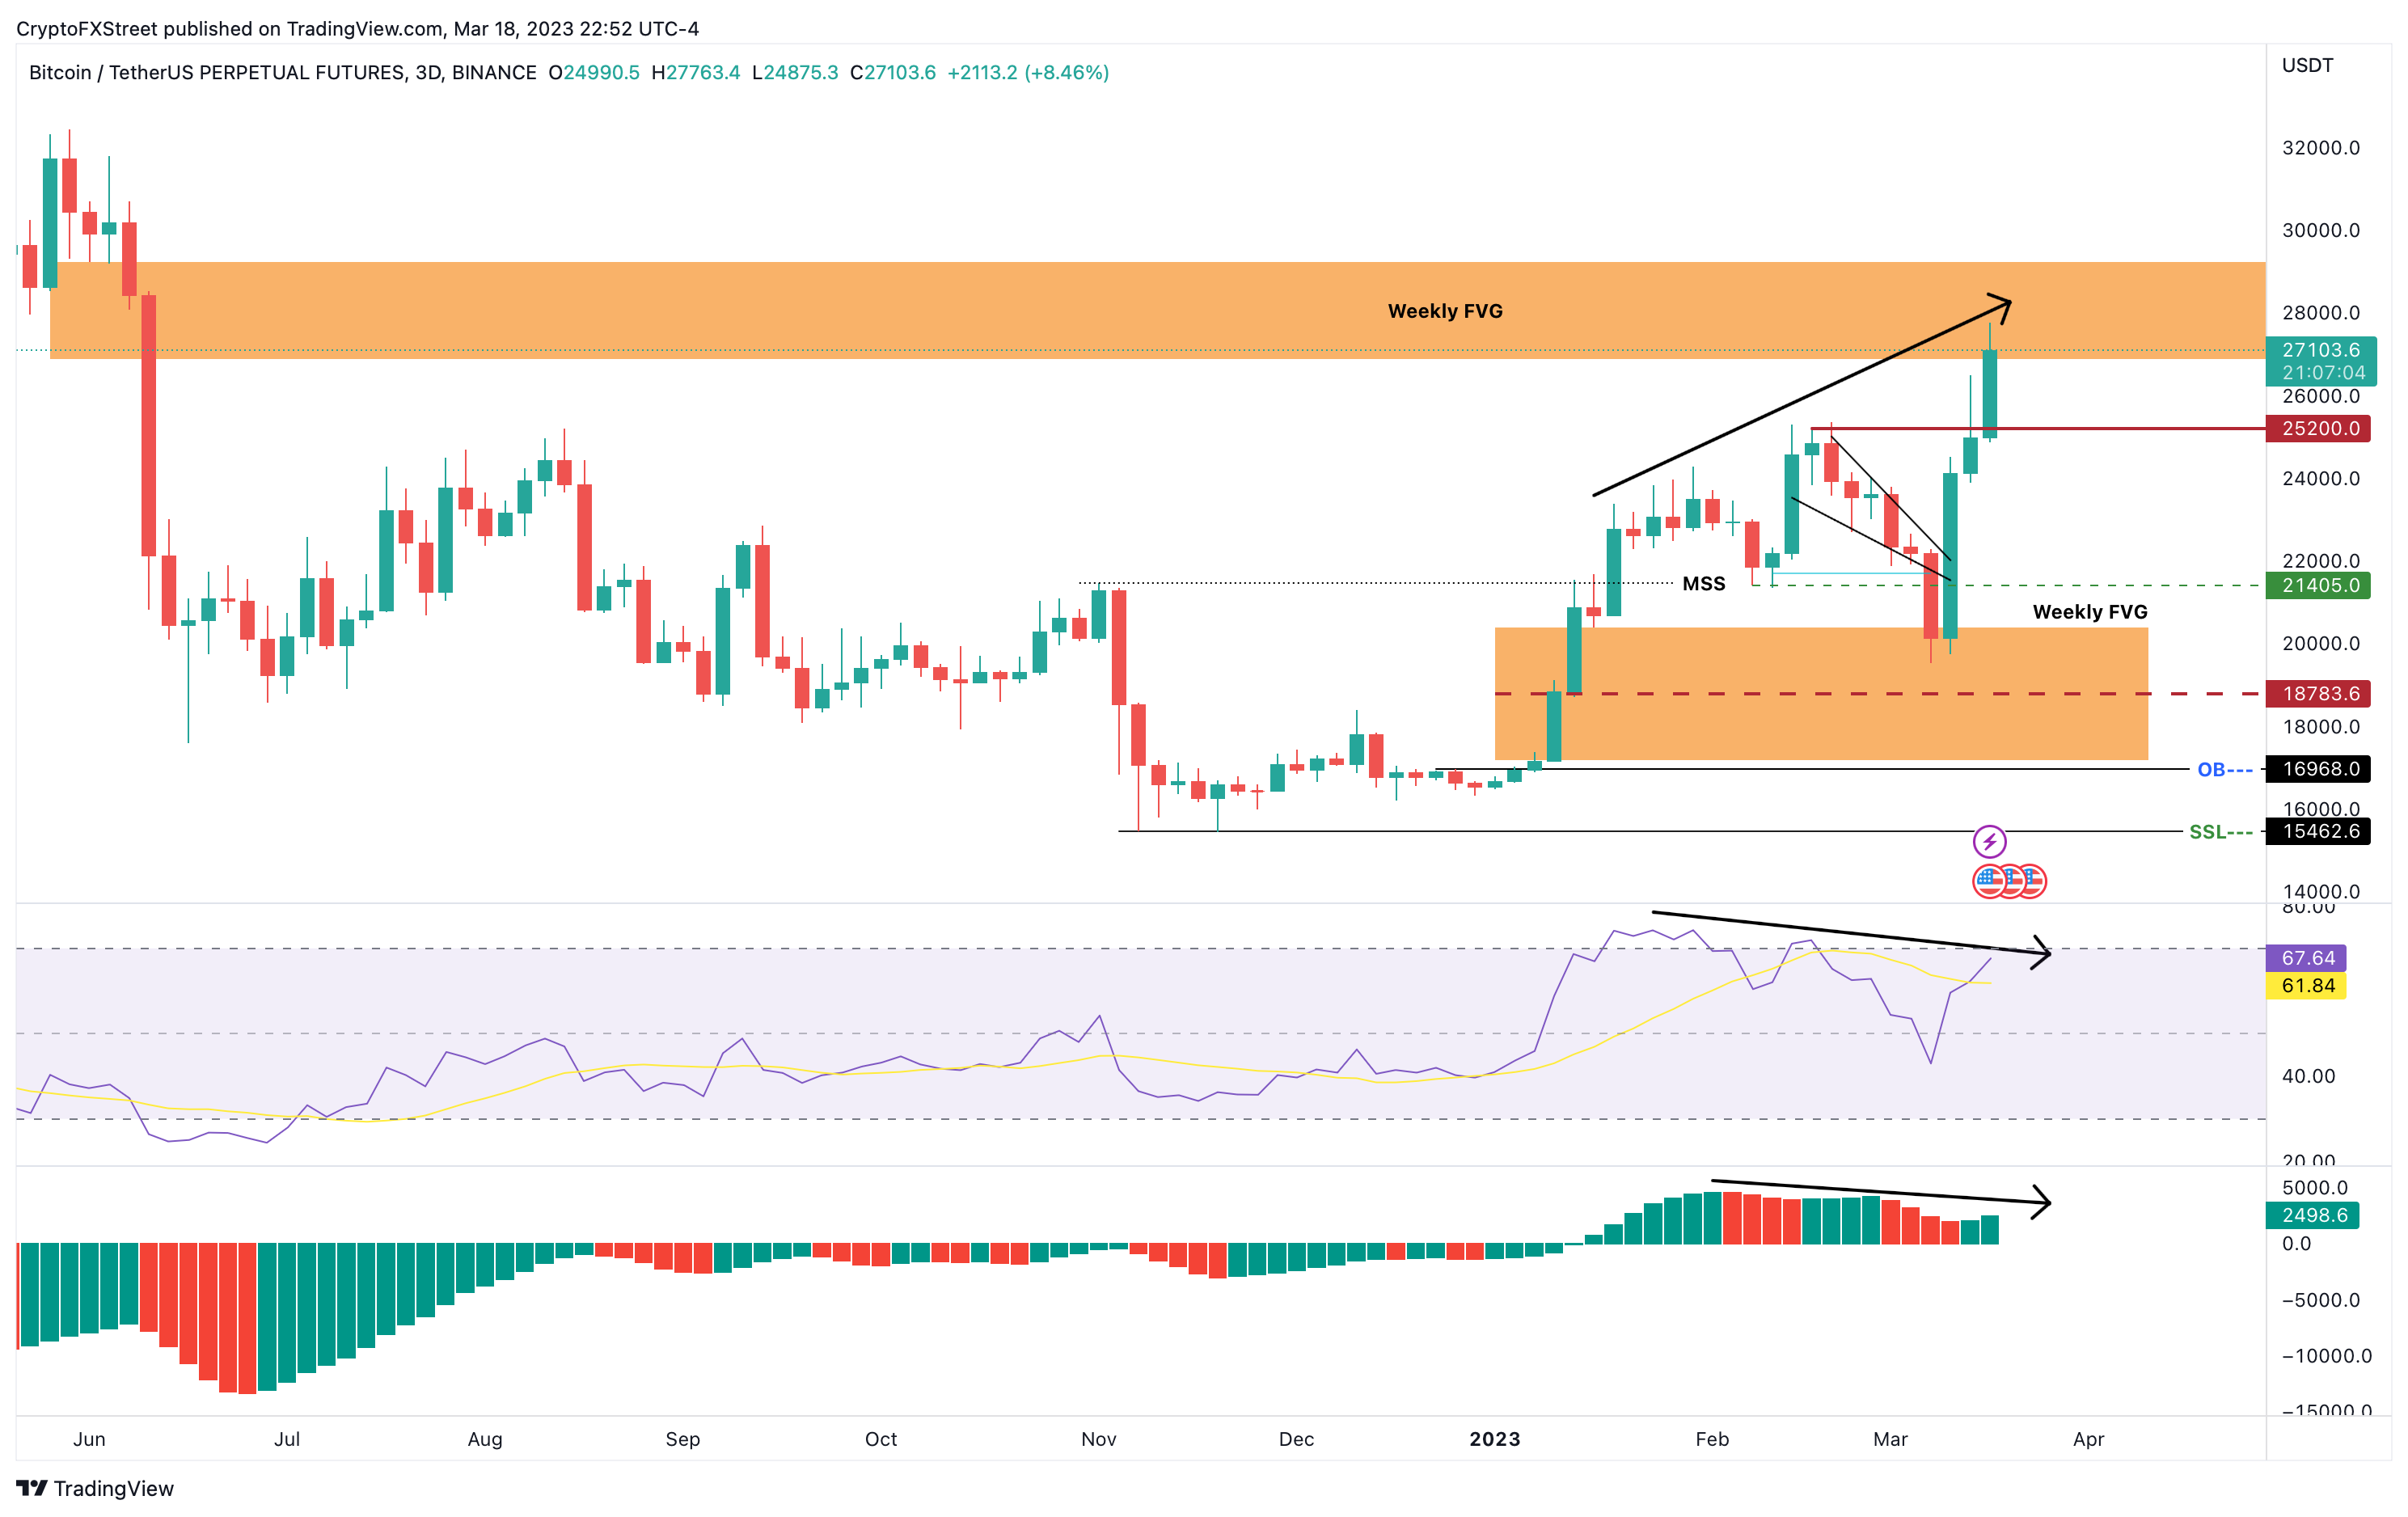
BTC/USDT 3-day chart
BTC holders wonder if this is a sell signal or buying opportunity
Considering that Bitcoin price depegged from the negative correlation with the US Dollar and rallied amidst the Banking Crisis of 2023 reveals the nature of this uptrend. Currently, BTC is reflecting the uncorrelated asset narrative.
Due to the collapse of the traditional finance banks, some of the stablecoin platforms were affected, which created initial selling pressure. One can speculate that as investors recovered from the FUD, they began thinking straight and started investing in Bitcoin, which is relatively more stable than the stablecoins.
So a capital inflow into Bitcoin could be the main reason for this rally. Hence, the bearish divergence could be a buying opportunity, provided BTC holds above the $21,405 support level. If successful, the next target for the pioneer crypto would be the upper limit of the sell-side inefficiency, stretching from $26,877 to $29,220.
However, a decisive flip of the $21,405 support level in a three-day chart would invalidate the bullish thesis for BTC. Such a development would trigger a deep correction for Bitcoin price that rebalances the buy-side imbalance, extending from $17,181 to $20,386.
Sellers could take this pullback to the next level and drive Bitcoin price lower to sweep the sell-side liquidity below equal lows at $15,462.
The video attached below explains key high timeframe levels to watch for Bitcoin price
Author

Akash Girimath
FXStreet
Akash Girimath is a Mechanical Engineer interested in the chaos of the financial markets. Trying to make sense of this convoluted yet fascinating space, he switched his engineering job to become a crypto reporter and analyst.


